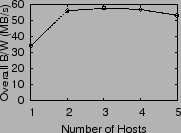
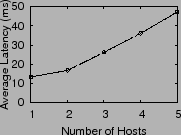
Next we examine how IO latency varies with increases in overall load (queue length) at the array. We experimented with one to five hosts accessing the same array. Each host generates a uniform workload of 16 KB IOs, 67% reads and 70% random, keeping 32 IOs outstanding. Figure 6 shows the aggregate throughput and average latency observed in the system, with increasing contention at the array. Throughput peaks at three hosts, but overall latency continues to increase with load. Ideally, we would like to operate at the lowest latency where bandwidth is high, in order to fully utilize the array without excessive queuing delay.
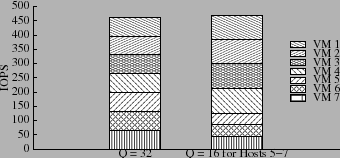
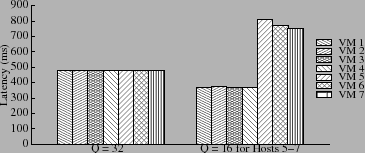
For uniform workloads, we also expect a good correlation between queue size and overall throughput. To verify this, we configured seven hosts to access a 400 GB volume on a 5-disk RAID-5 disk group. Each host runs one VM with an 8 GB virtual disk. We report data for a workload of 32 KB IOs with 67% reads, 70% random and 32 IOs pending. Figure 7 presents results for two different static host-level window size settings: (a) 32 for all hosts and (b) 16 for hosts 5, 6 and 7.
We observe that the VMs on the throttled hosts receive approximately
half the throughput (![]() IOPS) compared to other hosts (
IOPS) compared to other hosts (![]() IOPS) and their latency (
IOPS) and their latency (![]() 780 ms) is doubled compared to
others (
780 ms) is doubled compared to
others (![]() 360 ms). Their reduced performance is a direct result
of throttling, and the increased latency arises from the fact that a
VM's IOs were queued at its host. The device latency measured at the
hosts (as opposed to in the VM, which would include time spent in host
queues) is similar for all hosts in both experiments. The overall
latency decreases when one or more hosts are throttled, since there is
less load on the array. For example, in the second experiment, the
overall average latency changes from
360 ms). Their reduced performance is a direct result
of throttling, and the increased latency arises from the fact that a
VM's IOs were queued at its host. The device latency measured at the
hosts (as opposed to in the VM, which would include time spent in host
queues) is similar for all hosts in both experiments. The overall
latency decreases when one or more hosts are throttled, since there is
less load on the array. For example, in the second experiment, the
overall average latency changes from ![]() 470 ms at each host to
470 ms at each host to
![]() 375 ms at each host when the window size is 16 for hosts 5, 6,
and 7.
375 ms at each host when the window size is 16 for hosts 5, 6,
and 7.
|
|
We also experimented with four hosts sending different workloads to
the array while we varied their queue lengths in two phases.
Table 2 reports the workload description and
corresponding throughput and latency values observed at the hosts. In
phase 1, each host has a queue length of 32 while in phase 2, we
lowered the queue length for two of the hosts to 16. This experiment
demonstrates two important properties. First, overall throughput
reduces roughly in proportion to queue length. Second, if a host is
receiving higher throughput at some queue length ![]() due to its
workload being treated preferentially, then even for a smaller queue
length
due to its
workload being treated preferentially, then even for a smaller queue
length ![]() , the host still obtains preferential treatment from the
array. This is desirable because overall efficiency is improved by
giving higher throughput to request streams that are less expensive
for the array to process.
, the host still obtains preferential treatment from the
array. This is desirable because overall efficiency is improved by
giving higher throughput to request streams that are less expensive
for the array to process.
Ajay Gulati 2009-01-14