|
f
University of Illinois {wjiang3,chu7,yyzhou}@cs.uiuc.edu |
|
{shankarp,arkady}@netapp.com |
|
§
Pattern Insight, Inc. zhenmin.li@patterninsight.com |
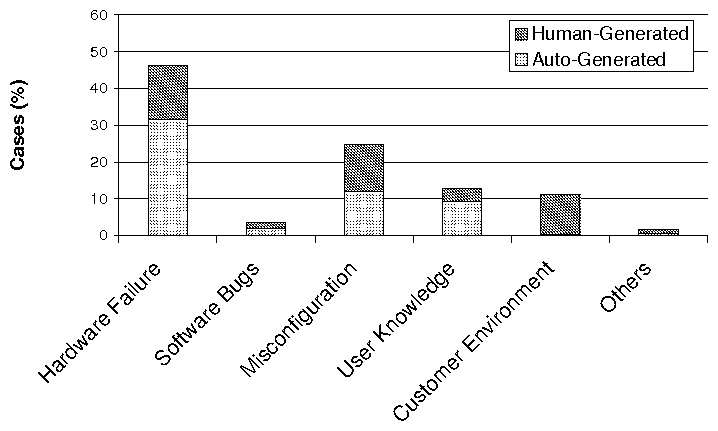
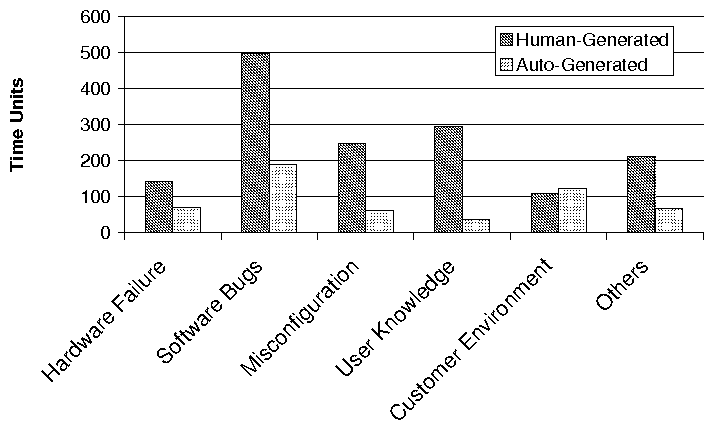 (a) Categorization of Problem Root Causes (b)
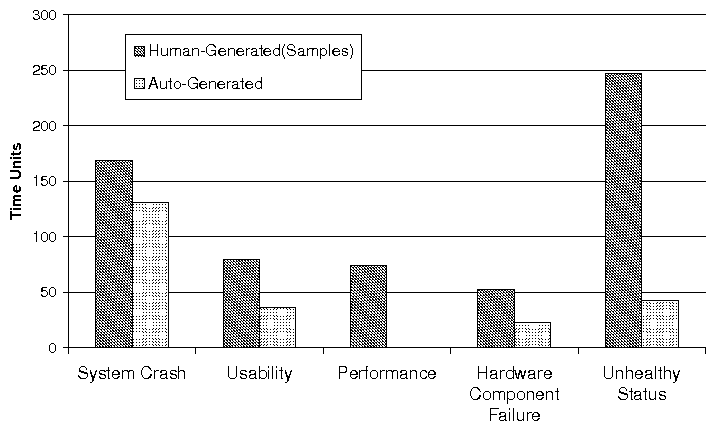
Average Resolution Time per Problem Root Cause Category
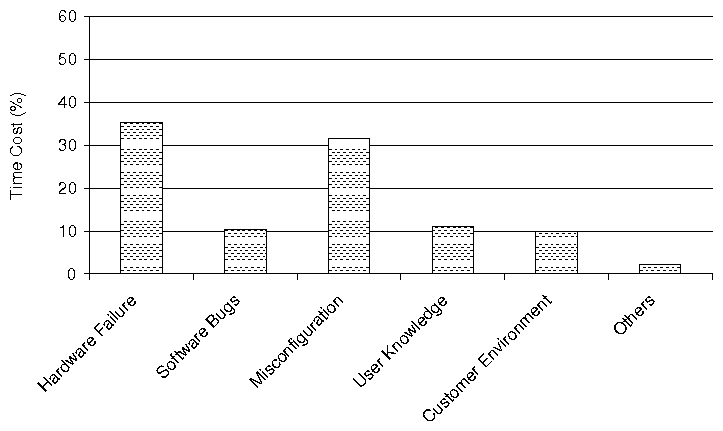
(a) Categorization of Problem Root Causes (b)
Average Resolution Time per Problem Root Cause Category
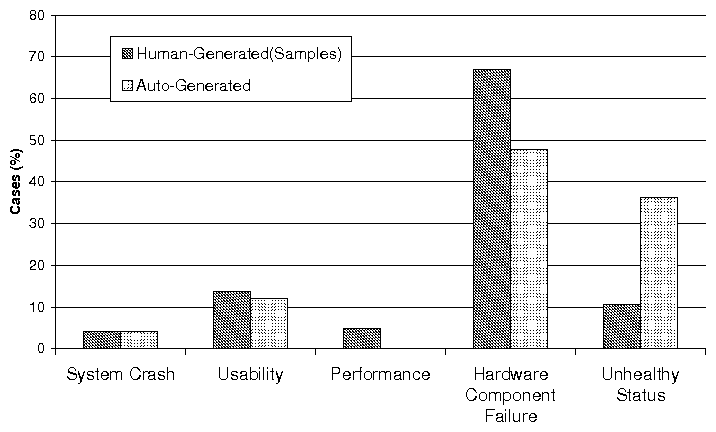
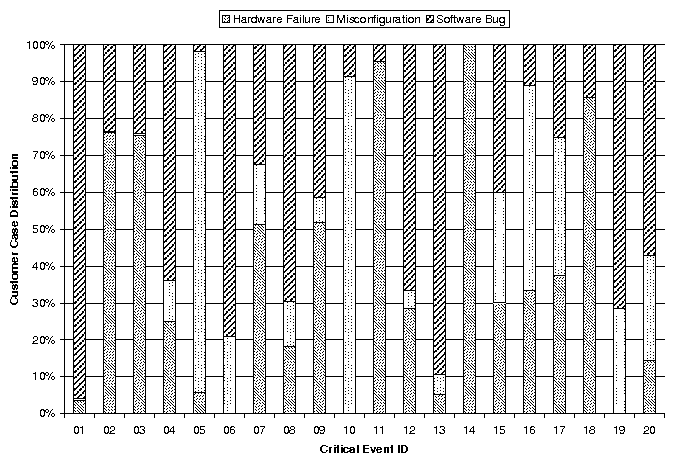
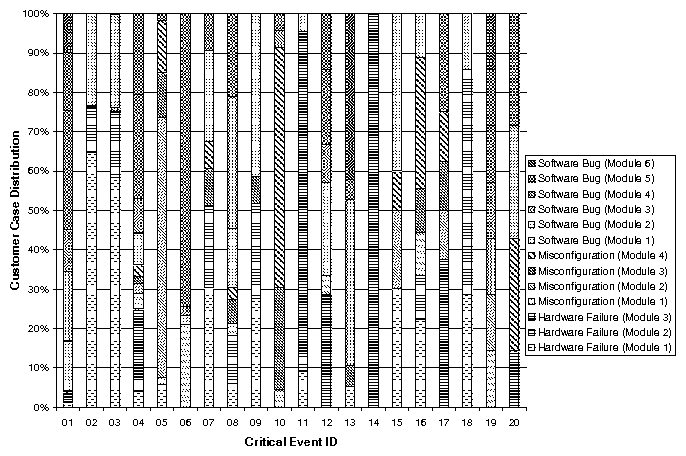
 (a) Distribution of Problems with Different Impact
(b) Average Resolution Time of Problem with Different Impact
(a) Distribution of Problems with Different Impact
(b) Average Resolution Time of Problem with Different Impact
| Problem # | Symptom | Cause | # of Key Events | Distance (secs) | Distance (# events) | Fuzziness? |
| 1 | Battery Low | Software Bug | 2 | 5.8 | 1.6 | no |
| 2 | Shelf Fault | Shelf Intraconnect Defect | 3 | 49.4 | 3.8 | yes |
| 3 | System Panic | Broken SCSI Bus Bridge | 4 | 509.2 | 34.4 | no |
| 4 | Performance Degradation | FC Loop Defect | 2 | 3652 | 69.4 | no |
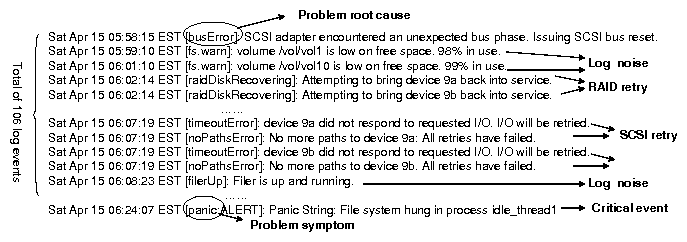
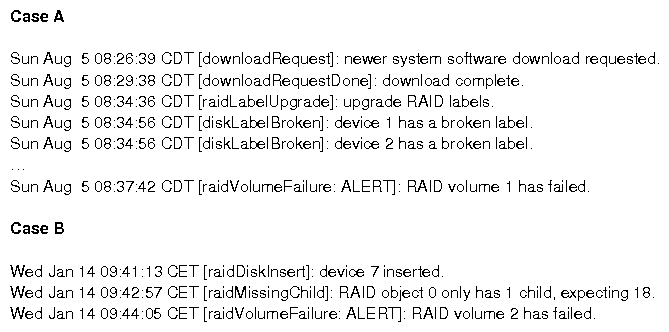
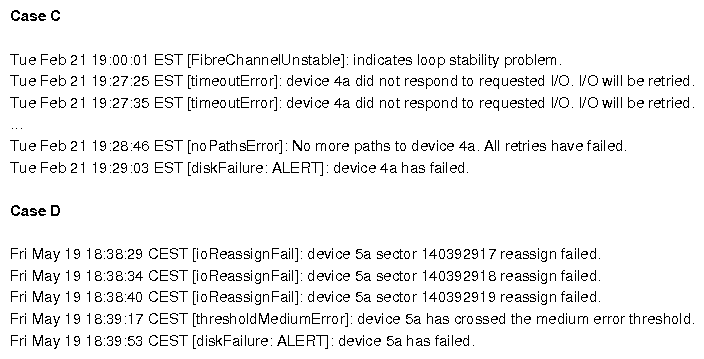
| 5(Figure 1) | Power Warning | Incorrect Threshold in Code | 2 | 5 | 2.4 | yes |
| 6(Figure 9A) | RAID Volume Failure | Software Bug | 3 | 196 | 66.5 | no |
| 7(Figure 9B) | RAID Volume Failure | Non-zeroed Disk Insertion | 3 | 80 | 35 | yes |
| 8 | RAID Volume Failure | Interconnect Failure | 3 | 290.5 | 126 | yes |
| 9 | Shelf Fault | Shelf Module Firmware Bug | 4 | 18285.5 | 21.5 | no |
| 10 | Shelf Fault | Power Supply Failure | 3 | 31.5 | 3.5 | no |