
Workload Decomposition for Power Efficient Storage Systems1
Lanyue Lu and Peter Varman
Rice University, Houston, TX, {ll2@rice.edu, pjv@rice.edu}
Power consumption and cooling costs of hosted storage services and shared storage infrastructure in data centers account for a growing percentage of the total cost of ownership. The bursty nature of storage workloads requires significant over provisioning of the capacity and power consumption to meet traditional response-time QoS guarantees. In this paper, we propose a graduated, distribution-based QoS model and a runtime scheduler for power efficient storage servers. Through the evaluation of the real storage workload traces, we show a new general tradeoff between the performance and power consumption.
1 Introduction
The widespread deployment of Internet-based services and the growing interest in application hosting have fueled the growth of large data centers having tens of thousands of disks.
The power density of these servers grows quickly, even up to 700 W/ [1], raising several challenging issues: the cost of energy consumption, the cost of cooling, environmental pollution, and secondary thermal effects. A typical data center with 1000 racks consuming 10MW total power, costs $7M for power and $4M-$8M for cooling per year, with $2M-$4M of up-front costs for cooling equipment [7]. Among the different components of the data center, the storage system accounts for a significant percentage of the total power consumption [11]. All of these issues result in strong incentives and motivations for developing energy efficient storage systems for current data centers.
As storage systems evolve towards a service-based paradigm, tradeoffs with regard to QoS performance guarantees, pricing, and resource provisioning assume increasing importance. Several QoS schedulers have been proposed in general server and network environments to provide throughput or response time guarantees based on Service Level Agreements (SLA) between clients and the service provider.
The server needs to provision enough resources (servers and their associated power and energy costs) to ensure that performance guarantees of the SLAs can be met.
A major difficulty in providing storage QoS is realistic resource provisioning due to the extremely bursty nature of storage workloads.
Since the instantaneous arrival rates can be significantly higher than the average long-term rate, provisioning based on worst-case traffic patterns result in
onerous capacity and power consumption requirements.
The mismatch in speeds between the rate of load fluctuations and the ability of storage devices like commodity hard disks to respond to dynamic power management techniques [10] makes it an enormous challenge to provide effective power management in
such environments.
In this paper, we provide a new framework for trading off performance and power consumption of storage systems based on a graduated, distribution-based QoS model. Many clients will willingly accept some performance deviation if the cost is lower or the service is more predictable [8], provided the degradation is quantifiable and bounded. For instance, the performance SLA may be specified by a distribution of response times rather than a worst-case latency. At run-time, the storage scheduler analyzes and decomposes the workload into classes with different latency bounds, and serves them concurrently without interference, to achieve the graduated performance guarantees.
These graduated QoS requirements result in very different capacity and power consumption costs, and (as we show in this paper) provide an opportunity to achieve significant power savings with relatively small performance impact.
Towards this end, we analyzed a set of storage workload traces to determine the tradeoff between QoS distribution and required server capacity and power consumption.
We confirm the existence of a well-defined knee in the QoS-power relation, whereby an overwhelming portion of the server power consumption is used to guarantee the
performance of a small fraction of the requests. By relaxing the performance guarantees for this small fraction, a significant reduction in server capacity and power consumption can be achieved while maintaining strong QoS guarantees for all but a small fraction of the workload.
The rest of the paper is organized as follows. In Section 2 we present an overview of the method, and the performance and power model for decomposing the workload. The evaluation results are presented in Section 3. The discussion is presented in Section 4. The paper concludes with Section 5.
2 Power Management Approach
Many proposals for power management of general servers and storage systems are based on exploiting the temporal periodicity in workloads [3,4,11]. A general stylized form is shown in Figure 1. The load fluctuates in daily, weekly or even monthly cycles, with periods of high load period and periods of low load. The periodic pattern provides opportunities for predicting the future traffic and varying the number of active servers (or storage pools) accordingly, to meet the performance requirements in different time periods. By keeping the inactive servers in the low power (or powered down) state power is conserved during periods of low utilization.
Figure 1:
Periodic workload in servers
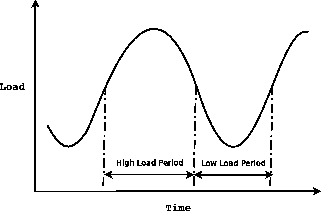 |
At the end of a time epoch, a prediction of the load in the next epoch is made, and enough servers are spun up (or down if transitioning to a low power epoch) to satisfy the performance QoS in that interval. Although the longer term trends of the workload are predictable, the workload tends to be very bursty at a finer granularity, meaning that the instantaneous arrival rates in some time intervals can be higher than the long-term rate by an order or two in magnitude. Thus during the high load period, estimates based on worst-case patterns result in significant over provisioning of capacity and increased power consumption. On the other hand, spinning up a powered-down commodity disk can take tens of seconds, and starting a server from the sleeping state needs up to several minutes to power on and warm up; hence, changing the number of active servers dynamically at a fine granularity is not a viable option. As a consequence, to meet the QoS performance requirements, a large number of servers, (in some cases maybe all the servers), are always kept powered on, although they are critical only for short periods of
bursty or worst-case activity. This results in significant power consumption even if most of the time the workload is relatively low.
By shaping the workload one can keep the number of active servers small, while providing an improved and quantifiable performance profile.
The scenario above motivates our performance models which explores a new tradeoff among the performance and power consumption, by shaping the workload to account for bursty traffic.
2.1 Performance Model
A general form of graduated QoS requirements for a storage server is described by its Response Time Distribution (RTD), a statistical distribution of its response time requirements. An  -tier RTD is a set of n pairs {
  :
:
 }, which specifies that a fraction
  of the workload's requests must have a response time
  or less. An RTD specifies a lower bound on the cumulative response time distribution achieved by that workload. A simple SLA in which 100% of the requests are guaranteed a maximum response time
  , corresponds to an RTD with
  . A 3-tier RTD {(0.9, 20ms), (0.99, 50ms), (1.0, 500ms)} indicates that no more than 10% of the requests can exceed 20 ms latency, and no more than 1% can exceed 50 ms, while all request must be served within a 500 ms response time.
Figure 2:
Architecture of Multi-queue Scheduler
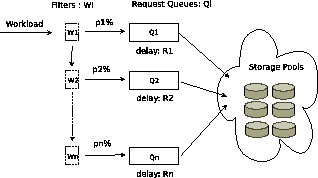 |
Figure 2 shows the system organization of an -tier RTD. The request stream of an application arriving at the workload shaper is partitioned into different classes  through
  , and directed to separate queues. Then the queues are multiplexed on the storage pools, that serve the requests with response time guarantees to each class. In this paper we will concentrate on a two-tier RTD architecture for simplicity; the extension to multiple QoS tiers is deferred to the full paper. In this case, the workload
  is partitioned into two classes and
  that will be referred to as primary and secondary classes respectively.
Figure 3:
Capacity on percentage of workload meeting specified latency bound for Financial Transaction trace
![\begin{figure*}\centering
\subfigure[$f$: from 90\% to 100\%]
{
\epsfig{figure=f...
...: from 99\% to 100\%]
{
\epsfig{figure=ft2_2.eps, width=2.8in} }
\end{figure*}](img16.png) |
Figures 3(a) and 3(b) show the QoS variation of the Financial Transaction workload from UMass Storage Repository as the capacity is varied. They show the server capacity in IOs/sec (IOPS) needed for a fraction  of the workload, to meet response time bounds of 50 ms, 20 ms and 10 ms, for between 90% and 100%, and 99% to 100% respectively. As can be seen,
the capacity required falls off significantly by exempting between 1% and 10% of the workload from the response time guarantee. For a 10 ms latency, the capacity increases almost 7 times (from 186 IOPS to 1300 IOPS) when increases from 90% to 100%, and by a factor of 4.3 in going from 99% to 100%. Corresponding capacity increases by factors of 4.8 (10%) and 3.4 (1%) for a response time of 20 ms can be observed. In fact, for response times of 10 ms, 20 ms and 50 ms, the capacity increases in going from 99.9% to 100% guarantees are by factors of 2.3, 1.7, and 1.5 respectively. Similar trends for other storage workload are noted from our experiments.
of the workload, to meet response time bounds of 50 ms, 20 ms and 10 ms, for between 90% and 100%, and 99% to 100% respectively. As can be seen,
the capacity required falls off significantly by exempting between 1% and 10% of the workload from the response time guarantee. For a 10 ms latency, the capacity increases almost 7 times (from 186 IOPS to 1300 IOPS) when increases from 90% to 100%, and by a factor of 4.3 in going from 99% to 100%. Corresponding capacity increases by factors of 4.8 (10%) and 3.4 (1%) for a response time of 20 ms can be observed. In fact, for response times of 10 ms, 20 ms and 50 ms, the capacity increases in going from 99.9% to 100% guarantees are by factors of 2.3, 1.7, and 1.5 respectively. Similar trends for other storage workload are noted from our experiments.
These experiments provide strong empirical evidence of the bursty nature of storage traces, and show the significant potential for optimizing capacity and power consumption using a graded QoS policy. Exempting even a small fraction of the workload from the response time guarantees can substantially reduce the capacity required, especially for aggressive service with low response time requirements. Motivated by this, we apply this model for reducing power consumption.
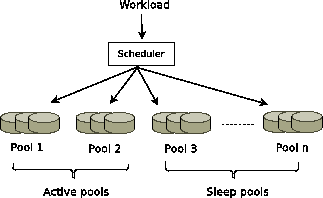
Figure 4 shows the basic architecture of the target storage system logically organized as multiple storage pools.
A pool may be considered as a logical volume that stores the entire data set.
For reliability and performance, data is replicated and stored multiply in several pools.
A pool is simply assumed to be made up of commodity disks connected by a high speed SAN. A disk may be in any of three states: sleep, idle or active. In the idle state the disk is powered
on but is not actively seeking, while in the active state it is performing a read or write operation. When in sleep mode, the disk is
assumed to consume negligible power.
The energy consumption of a single disk  is calculated by weighting its power consumption in a particular mode by the time spent in that mode.
The total energy is the sum of all the disks,
is calculated by weighting its power consumption in a particular mode by the time spent in that mode.
The total energy is the sum of all the disks,
 .
.
 |
(1) |
At the start of an epoch, a subset of the storage pools are placed in the powered on state (ON pools) and the rest are powered down in the sleep mode (OFF pools).
The number of ON pools is estimated by analyzing the workload using our workload analysis tool RTT (explained in section 2.3) and the
statistical QoS performance profile (RTD) discussed in Section 2.1.
We first use RTT to statically profile the workload to get the capacity requirement  for providing the QoS guarantees for the workload during this epoch. If the capacity of each pool is
  , then a conservative estimate of the number of pools that must be powered ON during this epoch is
 . Using the example in Figure 3, it requires a server capacity of
 IOPS to guarantee a 10 ms response time for 100% of the workload, while satisfying 99% of workload with a 10 ms deadline only requires a capacity of 300 IOPS. The remaining 1% is provided a much larger deadline (or is classified as best effort), and uses either the spare capacity from that provisioned for the 99% or a small additional amount. Suppose, for instance, we assume each pool has capacity
 IOPS, then provisioning 100% of workload needs 5 pools while provisioning 99% of workload only needs 1 active pool while keeping the remaining 4 pools in the OFF states for power conservation.
The RTT scheduler partitions the workload to different classes at runtime to obtain the required 99%-1% split,
and issues them to the underlying storage pools. Within the collection of ON pools, requests are sent to the disks in one pool as long as it can handle the workload. This allows the disks in the remaining pool to stay in the lower power idle state, until forced to become active to serve a request from an overloaded disk among the currently active disks.
Figure 4:
Runtime scheduler for storage pools
 |
2.3 Runtime Scheduler
Algorithm RTT (Response Time Threshold) is used to dynamically partition the workload by incorporating the response time requirement into the workload shaping policy.
In past work, a utilization-based strategy was proposed for overbooking of CPU resources [9] and end-to-end latency was used to profile network workloads in [5]. Both these algorithms are static methods that are used for off-line analysis of the performance trace.
Let the primary class receive capacity  (from the profiling as shown in Figure 3) and let
  be its response time bound.
If the number of queued requests is higher than
be its response time bound.
If the number of queued requests is higher than  , an incoming request is redirected to the secondary queue (with a more relaxed latency), since either this request or some other queued request will necessarily miss its deadline. Once can show that for a given server capacity RTT redirects the smallest number of requests
possible with that capacity.
, an incoming request is redirected to the secondary queue (with a more relaxed latency), since either this request or some other queued request will necessarily miss its deadline. Once can show that for a given server capacity RTT redirects the smallest number of requests
possible with that capacity.
Figure 5:
RTT decomposition of workload
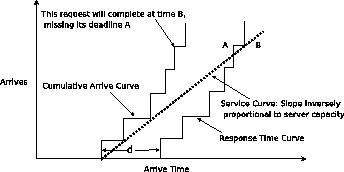 |
Figure 5 shows the operation of the RTT method [6]. The Cumulative Arrival Curve shows the total number of requests that have arrived at any time. An arriving request causes a jump in the arrival curve. The Service Curve models a constant rate server that completes requests at a rate equal to its capacity as long as there are requests in its queue. The Response Time Curve is obtained by time-shifting the arrival curve by the latency bound  ; it indicates the time by which a request must complete to meet its latency guarantee. Whenever the Service Curve crosses the Response Time curve, a request must be redirected to the secondary class.
3 Evaluation
We evaluated our storage system using the simulation tool DiskSim [2] with OpenMail, TPC-D and WebSearch traces obtained from UMass Storage Repository and HP Research Labs. The test system consists of several pools of storage, in which each pool contains several IBM Ultrastar 36Z15 disks as shown in Figure 4. For this disk model, the active power is 13.5 W and idle power is 10.2 W. In this experiment, the baseline system provisions enough capacity and power resources to serve the entire workload (100%) with a 20 ms response time guarantee. By decomposing the workload using RTT, we filter out the burstiest 1% of the workload and serve the remaining 99% with the same performance requirement as the baseline system.
Figure 6:
Power consumption for OpenMail, TPC-D and WebSearch workload
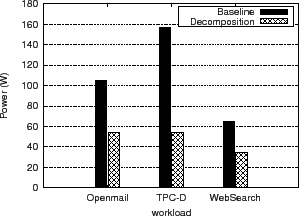 |
In Figure 6, we compare the power consumption of the baseline system and that obtained by the decomposition of the workloads. For OpenMail, TPC-D and WebSearch workloads, the power consumption of the baseline system is 1.93, 2.88 and 1.90 times of that obtained by decomposing the workload respectively while only serving 1% additional requests within 20 ms. We report the measured response times using the baseline system and the decomposed workload in Table 1.
We note that both finish their specified percentage within the guaranteed 20 ms bound.
From the CDF of the response time, we can see that for 10 ms, 15 ms and 20 ms,
the decomposition method works well with acceptable response time when compared with the baseline.
4 Discussion
One key issue we need to solve is how to handle the 1% requests that were filtered by RTT.
Since the QoS is specified using a response time distribution (RTD), this small percentage of requests can tolerate bigger latency compared to the remainder of the workload. One possible way is to provision the resource based on 99% of the workload meeting its guarantees, and treat the remaining on a best-effort basis. In this case, for the remaining 1%, we can monitor the spare capacity of the system, and issue these requests to the system when some spare capacity can be used. The benefit of this method is that it provides the minimum initial resource allocation, and uses free resource without extra resource cost. The drawback is that it needs to be careful not to compete with the base 99% of workload when issuing the 1% requests.
A complementary approach is to allocate additional resources for the 1%; because these requests have a larger response time requirement than the 99%, the sum of these two is still much smaller than provisioning the entire workload with the smaller response time requirement. (Experimental results not shown here.) We are currently exploring several alternative strategies to find the best approach, but the underlying conclusion remains valid that significant power savings are obtained by treating the 1% out-of-band.
In a multi-tier system, if the workload is decomposed appropriately coordinated with other tiers, it will not only conserve the power consumption of the storage system, but will also improve the power efficiency of the other tiers, such as the front end web servers.
5 Conclusion
In this paper, we propose a new graduated, distribution-based QoS model and a runtime scheduler for power efficient storage servers.
The approach addresses the difficulties of employing traditional dynamic power management techniques due to the bursty nature of typical
storage workloads, and the relatively long latencies in spinning up commodity storage devices. We employ a distribution-based QoS model to provide a larger space
to optimize the tradeoff between power and performance, by noting that even a small relaxation in performance guarantees results in significant reduction in capacity and power consumption. The method is complementary with current techniques based on predicting and exploiting periodicities in the workload patterns. Initial experimental results show promising potential for reducing power consumption using this approach.
- 1
-
L. A. Barroso, J. Dean, and U. Hölzle.
Web Search for A Planet: The Google Cluster Architecture.
IEEE Micro, 2003.
- 2
-
J. Bucy and G. Ganger.
The DiskSim Simulation Environment Version 3.0.
https://www.pdl.cmu.edu/DiskSim/, 2003.
- 3
-
J. S. Chase, D. C. Anderson, P. N. Thakar, A. M. Vahdat, and R. P. Doyle.
Managing Energy and Server Resources in Hosting Centers.
In Proceedings of the ACM Symposium on Operating Systems
Principles(SOSP), 2001.
- 4
-
G. Chen, W. He, J. Liu, S. Nath, L. Rigas, L. Xiao, and F. Zhao.
Energy-Aware Server Provisioning and Load Dispatching for
Connection-Intensive Internet Services.
In Proceedings of the USENIX Symposium on Networked Systems
Design and Implementation (NSDI), 2008.
- 5
-
T. Dumitras and P. Narasimhan.
Fault-tolerant middleware and the magical 1%.
In Proceedings of the Middleware, 2005.
- 6
-
L. Lu, K. Doshi, and P. Varman.
Workload Decomposition for QoS in Hosted Storage Services.
In Proceedings of the Middleware MW4SOC Workshop, 2008.
- 7
-
S. Rivoire, M. A. Shah, P. Ranganathan, and C. Kozyrakis.
JouleSort: A Balanced Energy-Efficiency Benchmark.
In Proceedings of the ACM SIGMOD, 2007.
- 8
-
B. Schroeder, M. Harchol-Balter, A. Iyengar, and E. Nahum.
Achieving class-based qos for transactional workloads.
In Proceedings of the ICDE, Poster paper, 2006.
- 9
-
B. Urgaonkar, P. Shenoy, and T. Roscoe.
Resource overbooking and application profiling in shared hosting
platforms.
In Proceedings of the Symposium on Operating Systems Design and
Implementation(OSDI), 2002.
- 10
-
H. Zeng, C. Ellis, A. Lebeck, and A. Vahdat.
Currentcy: Unifying Policies for Resource Management.
In Proceedings of the USENIX Annual Technical Conference, 2003.
- 11
-
Q. Zhu, Z. Chen, L. Tan, Y. Zhou, K. Keeton, and J. Wikes.
Hibernator: Helping Disk Arrays Sleep through the Winter.
In Proceedings of the ACM Symposium on Operating Systems
Principles(SOSP), 2005.
Workload Decomposition for Power Efficient Storage Systems1
This document was generated using the
LaTeX2HTML translator Version 2002-2-1 (1.71)
Copyright © 1993, 1994, 1995, 1996,
Nikos Drakos,
Computer Based Learning Unit, University of Leeds.
Copyright © 1997, 1998, 1999,
Ross Moore,
Mathematics Department, Macquarie University, Sydney.
The command line arguments were:
latex2html -split 0 -show_section_numbers -local_icons -no_navigation paper.tex
The translation was initiated by Lanyue on 2008-11-13
Footnotes
- ... Systems1
- Supported by NSF Grant CNS 0615376
Lanyue
2008-11-13