Anubis is a dynamic malware analysis platform that executes submitted binaries in a controlled environment. To perform the analysis, the system monitors the invocation of important Windows API calls and system services, it records the network traffic, and it tracks data flows. For each submission, reports are generated that provide comprehensive reports about the activities of the binary under analysis. Anubis receives malware samples through a public web interface and a number of feeds from security organizations and anti-malware companies. Because the samples are collected from a wide range of users, the collected samples represent a comprehensive and diverse mix of malware found in the wild. In this paper, we aim to shed light on common malware behaviors. To this end, we evaluate the Anubis analysis results for almost one million malware samples, study trends and evolution of malicious behaviors over a period of almost two years, and examine the influence of code polymorphism on malware statistics.
Malicious software (or malware) is one of the most pressing and major security threats facing the Internet today. Anti-virus companies typically have to deal with tens of thousands of new malware samples every day. Because of the limitations of static analysis, dynamic analysis tools are typically used to analyze these samples, with the aim of understanding how they behave and how they launch attacks. This understanding is important to be able to develop effective malware countermeasures and mitigation techniques.
In this paper, we set out to provide insights into common malware behaviors. Our analysis and experiences are based on the malicious code samples that were collected by Anubis [1,5], our dynamic malware analysis platform. When it receives a sample, Anubis executes the binary and monitors the invocation of important system and Windows API calls, records the network traffic, and tracks data flows. This provides a comprehensive view of malicious activity that is typically not possible when monitoring network traffic alone.
Anubis receives malware samples through a public web interface and a number of feeds from security organizations and anti-malware companies. These samples are collected by honeypots, web crawlers, spam traps, and by security analysts from infected machines. Thus, they represent a comprehensive and diverse mix of malware found in the wild. Our system has been live for a period of about two years. During this time, Anubis has analyzed almost one million unique binaries (based on their MD5 file hashes). Given that processing each malware program is a time consuming task that can take up to several minutes, this amounts to more than twelve CPU years worth of analysis.
When compiling statistics about the behaviors of malicious code, one has to consider that certain malware families make use of polymorphism. Since samples are identified based on their MD5 file hashes, this means that any malware collection typically contains more samples of polymorphic malware programs than of non-polymorphic families. Unfortunately, this might skew the results so that the behavior (or certain actions) of a single, polymorphic family can completely dominate the statistics. To compensate for this, we analyze behaviors not only based on individual samples in our database but also based on malware families (clusters).
For this paper, we performed an analysis of almost one million malware samples. The main contribution are statistics about and insights into malicious behaviors that are common among a diverse range of malware programs. We also consider the influence of code polymorphism on malware statistics. To this end, we compare analysis results based on individual samples to results based on malware families.
Researchers have extensively studied the malware problem domain. One line of research has focused on the extent to which certain classes of malware have penetrated the Internet. For example, there have been studies that quantify the size of botnets [17], the number of executables infected with spyware [14], and the number of malicious web sites that launch drive-by downloads [16]. Another line of research deals with tools to collect and study malware. Here, researchers have introduced various forms of honeypots [3,18], static analysis techniques [7], and dynamic monitoring tools [8,19]. Finally, there are proposals to detect and remove malware once it has infected a machine, using either signature-based or behavior-based approaches.
While previous research has shed light on many aspects of malicious code, relatively little is known about the behavior of malicious programs once they infect a host. With behavior, we refer to the interaction of a program with the host operating system, other applications, or the network. Of course, a few popular malware families are very well-understood [13]. Also, folk wisdom associates with malware behavior programs that read and copy their own executables into the Windows system folder. Finally, network activity has been analyzed more thoroughly [11], possibly because it is more straightforward to collect and evaluate. However, there is little knowledge about general, host-based interactions that are characteristic for or common among a large and diverse set of different malware families. For example, we would like to know common mechanisms that malware binaries use to propagate, to make their programs persistent, and to evade detection. On one hand, such information is valuable to better understand the motives and goals of malware authors and to see the ways in which malicious code evolves over time. On the other hand, the information is crucial for the development of better behavior-based detection techniques.
In this section, we give a brief overview of the data that Anubis collects. As mentioned previously, a binary under analysis is run in an emulated operating system environment (a modified version of Qemu [6]) and its (security-relevant) actions are monitored. In particular, we record the Windows native system calls and Windows API functions that the program invokes. One important feature of our system is that it does not modify the program that it executes (e.g., through API call hooking or breakpoints), making it more difficult to detect by malicious code. Also, our tool runs binaries in an unmodified Windows environment, which leads to good emulation accuracy. Each sample is run until all processes are terminated or a timeout of four minutes expires. Once the analysis is finished, the observed actions are compiled in a report and saved to a database.
Our dataset covers the analysis reports of all files that were submitted to Anubis in the period from February 7th 2007 to December 31st 2008, and that were subsequently analyzed by our dynamic analysis system in the time period between February 7th 2007 and January 14th 2009. This dataset contains 901,294 unique samples (based on their MD5 hashes) and covers a total of 1,167,542 submissions. Typically, a given sample is only analyzed once by our analysis system. That is, when a sample is submitted again, we return the already existing analysis report without doing an actual analysis.
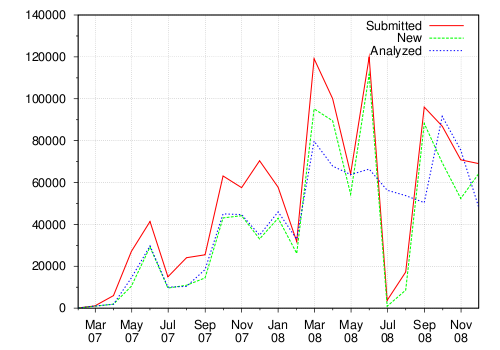
Figure 1 shows the number of total samples, the number of new samples, and the number of actually analyzed samples submitted to Anubis, grouped by months. We consider a file as being new when, at the time of its submission, we do not have a file with the same MD5 hash in our repository. As one can see, we have analyzed about fifty thousand samples on average per month in the year 2008. When we first launched the Anubis online analysis service, we received only few samples. However, as the popularity of Anubis increased, it was soon the computing power that became the bottleneck. In fact, in July and August 2008, we had to temporarily stop some automatic batch processing to allow our system to handle the backlog of samples.
Naturally, the Anubis tool has evolved over time. We fixed bugs in later versions or added new features. Given that there is a constant stream of new malware samples arriving and the analysis process is costly, we typically do not rerun old samples with each new Anubis version. Unfortunately, this makes it a bit more difficult to combine analysis results that were produced by different versions of Anubis into consolidated statistics. In some cases, it is possible to work around such differences. In other cases (in particular, for the analysis of anti-sandbox techniques presented Section 4.6), we had to confine ourselves to results for a smaller subset of 330,088 analyzed PE files. The reason is that necessary information was not present in older reports.
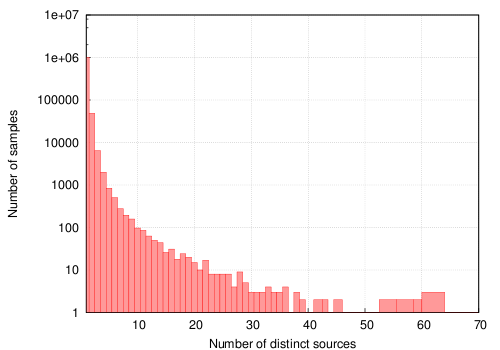
Figure 2 shows the number of different sources that submit a particular sample to Anubis. The graph illustrates that most of the samples we receive are submitted by one source only. Even though the curve decreases quickly, there is still a significant number of samples that are submitted by 10 to 30 different sources.
We have made the experience that measuring the number of sources that submit a certain sample tends to indicate how widespread a certain malware sample is in the wild. In fact, this premise is supported by the results of the anti-virus scans that we run on each sample that we receive. For example, if we consider the samples submitted by one source, 73% of the submissions are categorized by two out of five anti-virus scanners as being malicious. In comparison, 81% of the submissions that are submitted by at least 3 different sources are identified as being malicious by anti-virus software. Furthermore, among the samples that are submitted by 10 or more sources, 91% are identified as being malicious.
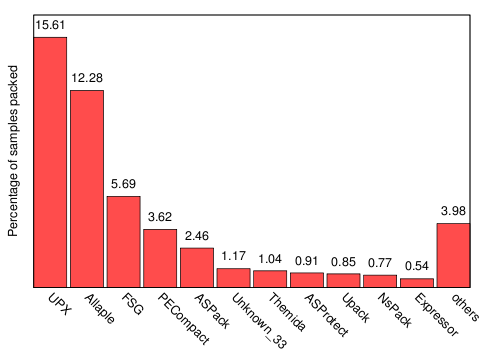
One problem with running an online, public malware analysis service is that one can receive all sorts of data, not only malware. In fact, users might even try to submit applications such as Microsoft Word or Microsoft Internet Explorer just to see how the system reacts. Furthermore, unfortunately, not all the submitted samples are valid Windows PE executables [12] (around 14% are not). Table 1 shows a breakdown of the different file types submitted to Anubis. As can be seen from this table, fortunately for us, most of the files that are sent to Anubis can be analyzed. The category of non PE files includes mostly different archive formats (ZIP and RAR archives) and MS Office documents (such as Word and Excel), but also a small number of shell scripts and executables for different operating systems (such as DOS, Linux). According to SigBuster, a signature-based scanner for packers, 40.64% of the analyzed PE files are packed. Figure 3 provides an overview of the most common packers.
|
Over the two-year time period that we have provided the service, Anubis received samples from more than 120 different countries. Depending on the number of samples submitted, we have grouped the Anubis submitters into four different categories: large, medium, small, single. We define a large submitter as an entity (i.e., a person, an organization) that has submitted more than one thousand different (per MD5 hash) samples. A medium submitter is an entity that has submitted between 100 and 1,000 different samples. A small submitter is an entity that has submitted between 10 and 100 different samples, and finally, a single submitter is an entity that has submitted less than 10 samples. Table 3 summarizes our findings.
|
Note that there are 20 large submitters (with more than one thousand different samples submitted) who account for almost 90% of the Anubis submissions. Interestingly, the number of single submitters is very high. However, these users are only responsible for about 5% of the total submissions. According to anti-virus results that we run on every submitted sample, the medium submitters (probably represented by malware analysts) are more reliable in submitting malicious samples (i.e., 75% of their submissions are flagged as being malicious). In comparison, only 50% of the samples submitted by single submitters are identified as being malicious, suggesting that single individuals are probably more likely to submit random files, possibly to test the Anubis system.
In this section, we present detailed discussions on the file, registry, network, and botnet activity that we observed when analyzing the Anubis submissions. The goal is to provide insights into malicious behaviors that are common among a diverse range of malware programs. An overview of interesting activity is shown in Table 2. In this table, we show the fraction of samples that perform certain high-level activity. We also provide the behavioral information with respect to the number of malware families, approximated as clusters of samples that exhibit similar behaviors [4]. It is interesting to observe that the differences are often not very pronounced. One reason is that the clustering process was using a tight threshold. That is, samples are only grouped when they exhibit very similar activity, resulting in a large number of clusters. Another reason is that the activity in Table 2 is quite generic, and there is not much difference at this level between individual samples and families. The situation changes when looking at activity at a level where individual resources (such as files, registry keys) are considered. For example, 4.49% of all samples create the file C:\WINDOWS\system32\urdvxc.exe, but this is true for only 0.54% of all clusters. This file is created by the well-known, polymorphic allaple worm, and many of its instances are grouped in a few clusters. Another example can be seen in Table 4. Here, 17.53% of all samples use a specific registry key for making the malware persistent. When looking at the granularity of clusters (families), this number drops to 11.67%. Again, the drop is due to the way in which allaple operates. It also demonstrates that using statistics based on malware clusters is more robust when large clusters of polymorphic malware samples are present in the dataset.
|
Looking at Table 2, we can see that, unsurprisingly, the execution of a large number of malware samples (70.8% of all binaries) lead to changes on the file system. That is, new files are created and existing files are modified.
When analyzing the created files in more detail, we observe that they mostly belong to two main groups: One group contains executable files, typically because the malware copies or moves its binary to a known location (such as the Windows system folder). Often, this binary is a new polymorphic variant. In total, 37.2% of all samples create at least one executable file. Interestingly, however, only 23.2% of all samples (or 62% of those that drop an executable) choose the Windows directory or one of its sub-folders as the target. A large fraction - 15.1% - create the executable in the user's folder (under Document and Settings). This is interesting, and might indicate that, increasingly, malware is developed to run successfully with the permissions of a normal user (and hence, cannot modify the system folder).
The second group of files contains non-executables, and 63.8% of all samples are responsible for creating at least one. This group contains a diverse mix of temporary data files, necessary libraries (DLLs), and batch scripts. Most of the files are either in the Windows directory (53% of all samples) or in the user folder (61.3%4). One aspect that stands out is the significant amount of temporary Internet files created by Internet Explorer (in fact, the execution of 21.3% of the samples resulted in at least one of such files). These files are created when Internet Explorer (or, more precisely, functions exported by iertutil.dll) are used to download content from the Internet. This is frequently used by malware to load additional components. Most of the DLLs are dropped into the Windows system folder.
The modifications to existing files are less interesting. An overwhelming majority of this activity is due to Windows recording events in the system audit file system32\config\SysEvent.Evt. In a small number of cases, the malware programs infect utilities in the system folder or well-known programs (such as Internet Explorer or the Windows media player).
In the next step, we examined the deleted files in more detail. We found that most delete operations target (temporary) files that the malware code has created previously. Hence, we explicitly checked for delete operations that target log files and Windows event audit files. Interestingly, Windows malware does not typically attempt to clear any records of its activity from log data (maybe assuming that users will not check these logs). More precisely, we find that 0.26% of the samples delete a *log file, and only 0.0018% target *evt files.
We also checked for specific files or file types that malware programs might look for on an infected machine. To this end, we analyzed the file parameter to the NtQueryDirectoryFile system call, which allows a user (or program) to specify file masks. We found a number of interesting patterns. For example, a few hundred samples queried for files with the ending .pbk. These files store the dial-up phone books and are typically accessed by dialers. Another group of samples checked for files ending with .pbx, which are Outlook Express message folder.
A significant number of samples (62.7%) create registry entries. In most cases (37.7 % of those samples), the registry entries are related to control settings for the network adapter. Another large fraction - 22.7% of the samples - creates a registry key that is related to the unique identifiers (CLSIDs) of COM objects that are registered with Windows. These entries are also benign. But since some malware programs do not change the CLSIDs of their components, these IDs are frequently used to detect the presence of certain malware families. We did also find two malicious behaviors that are related to the creation of registry entries. More precisely, a fraction (1.59%) of malware programs creates an entry under the key SystemCertificates\ TrustedPublisher\Certifi- cates. Here, the malware installs its own certificate as trusted. Another group of samples (1.01 %) created the Windows\ CurrentVersion\Policies\System key, which prevents users from invoking the task manager.
We also examined the registry entries that malware programs typically modify. Here, one of the most-commonly-observed malicious behavior is the disabling of the Windows firewall - in total, 33.7% of all samples, or almost half of those that modify Windows keys, perform this action. Also, 8.97% of the binaries tamper with the Windows security settings (more precisely, the MSWindows\ Security key). Another important set of registry keys is related to the programs that are automatically launched at startup. This allows the malware to survive a reboot. We found that 35.8% of all samples modify registry keys to get launched at startup. We list that Top 10 Autostart locations in Table 4. As can be seen, the most common keys used for that purpose are Currentversion\Run with 16.0% of all samples and Services\Imagepath with 17.53%. The Services registry key contains all configuration information related to Windows services. Programs that explicitly create a Windows service via the Windows API implicitly also modify the registry entries under this key.
|
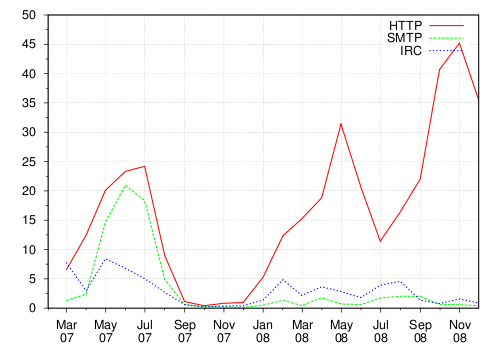
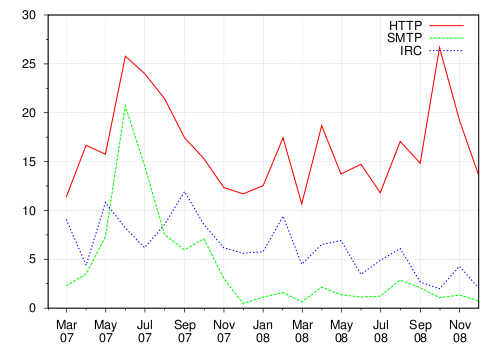
Table 5 provides an overview of the network activities that we observed during analysis. Figure 4 depicts the use of the HTTP, IRC, and SMTP protocols by individual samples over a one and a half year period. In contrast, Figure 5 shows the usage of the HTTP, IRC, and SMTP protocols once families of malware samples are clustered together (using our clustering approach presented in [4]). These two graphs clearly demonstrate the usefulness of clustering in certain cases. That is, when the first graph is observed, one would tend to think that there is an increase in the number of samples that use the HTTP protocol. However, after the samples are clustered, one realizes that the use of the HTTP protocol remains more or less constant. Hence, the belief that there is an increase in HTTP usage is not justified, and is probably caused by an increase in the number of polymorphic samples. However, the graph in Figure 5 supports the assumption that IRC is becoming less popular.
Moreover, we observed that 796 (i.e., 0.23%) of the samples used SSL to protect the communication. Almost all use of SSL was associated to HTTPS connections. However, 8 samples adopted SSL to encrypt traffic targeting the non-standard SSL port (443). Interestingly, most of the time the client attempted to initiate an SSL connection, it could not finish the handshake.
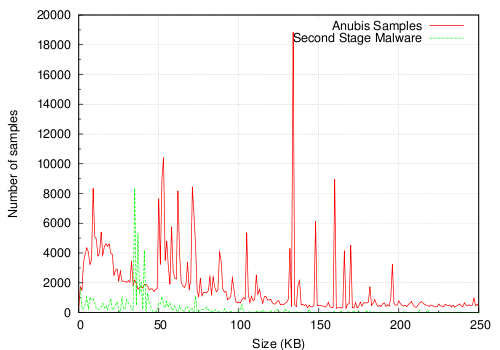
In the samples that we analyzed, only half of the samples (47.3%) that show some network activity also query the DNS server to resolve a domain name. These queries were successful most of the time. However, in 9.2% of the cases, no result was returned. Also, 19% of the samples that we observed engaged in scanning activity. These scans were mostly initiated by worms that scan specific Windows ports (e.g., 139, 445) or ports related to backdoors (e.g., 9988 - Trojan Dropper Agent). Finally, 8.9% of the samples connected to a remote site to download another executable. Figure 6 shows the file sizes of these second stage malware programs, compared with the size of the executable samples submitted to Anubis. As one may expect, the second stage executables are in average smaller than the first stage malware.
Note that over 70% of the samples that downloaded an executable actually downloaded more than one. In fact, we observed one sample that downloaded the same file 178 times during the analysis time of four minutes (i.e., the download was corrupted with each download, so the sample immediately attempted another download).
Table 2 shows that a surprising fraction of samples (33.26%) display a GUI window. Closer analysis reveals that only a small set (2.2%) is due to program crashes. The largest fraction (4.47%) is due to GUI windows that come without the usual window title and contain no window text. Although we were able to extract window titles or window text in the remaining cases, it is difficult to discover similarities. Window names and texts are quite diverse, as a manual analysis of several dozens of reports confirmed. The majority of GUI windows are in fact simple message boxes, often pretending to convey an error of some kind. We believe that their main purpose lies in minimizing user suspicion. An error message draws less attention than a file that does not react at all when being double clicked. For example, 1.7% of the samples show a fabricated message box that claims that a required DLL was not found. However, if this error message was authentic, it would be created on behalf of the csrss.exe process.
Although a relative recent phenomenon, botnets have quickly become one of the most significant threats to the security of the Internet. Recent research efforts have led to mechanisms to detect and disrupt botnets [10]. To determine how prevalent bots are among our submissions, we analyzed the network traffic dumps that Anubis has recorded. For this, we were interested in detecting three bot families: IRC, HTTP, and P2P.
The first step in identifying a bot based on an analysis report is to determine the network protocol that is being used. Of course, the protocol detection needs to be done in a port-independent fashion, as a bot often communicates over a non-standard port. To this end, we implemented detectors for IRC, HTTP, and the following P2P protocols: BitTorrent, DirectConnect, EDonkey, EmuleExtension, FastTrack, Gnutella, and Overnet.
In the next step, we need to define traffic profiles that capture expected, bot-like behaviors. Such profiles are based on the observation that bots are usually used to perform distributed denial-of-service (DDoS) attacks, send out many spam e-mails, or download malicious executables. Hence, if we see signs for any such known activity in a report (e.g., address scans, port scans, DNS MX queries, a high number of SMTP connections, etc.), we consider this sample a bot candidate. In addition, we use some heuristics to detect known malicious bot conversations such as typical NICKNAME, PRIVMSG, and TOPIC patterns used in IRC communication, or common HTTP bot patterns used in URL requests. The bot analysis is also used to create a blacklist of identified command and control servers. This blacklist is constantly updated and is also used to identify and verify new bot samples.
Our analysis identified 36,500 samples (i.e., 5.8%) as being bots (i.e., 30,059 IRC bots, 4,722 HTTP bots, and 1,719 P2P bots). Out of the identified samples, 97.5% were later correctly recognized by at least two anti-virus as malware. However, it was often the case that anti-virus programs misclassified the sample, e.g. by flagging a storm worm variation as an HTTP Trojan. Also, all P2P bots we detected were variations of the Storm worm.
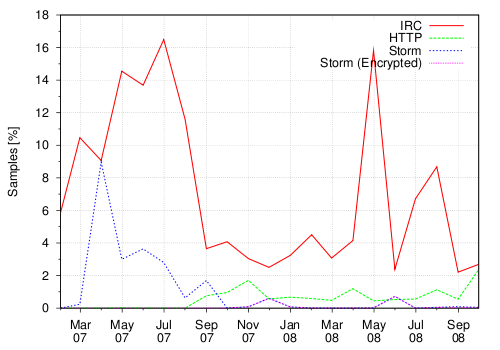
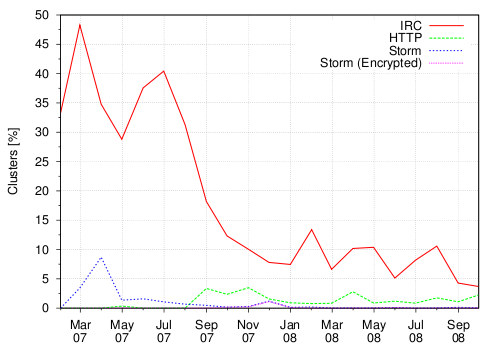
Figure 7 and 8 show the bot submission (grouped by type) based on unique samples and unique clusters, respectively. By comparing the IRC botnet submissions in the two graphs, we can observe that, in 2007, most of IRC botnets were belonging to different clusters. In 2008 instead, we still received an high number of IRC bots, but they were mostly polymorphic variations of the same family. As an example, the peak that we observed in May 2008 is due to a large number of polymorphic variations of W32.Virut.
Interestingly, we are able to identify samples that, months after their first appearance, are still not recognized by any anti-virus software. This is probably due to the polymorphism and metamorphism techniques used in the malware code. We also verified how many samples were identified by one anti-virus vendor as being a bot and cross-checked these samples with our detection technique. We missed 105 samples that the anti-virus software was able to detect. One reason for this could be the four-minute maximum runtime limit for the samples emulated in the Anubis system.
The Storm worm began infecting thousands of computers in Europe and the United States on Friday, January 19, 2007. However, Anubis received the first storm collection (96 samples) in April 2007. Note that most of the submitted samples of Storm after October 1st are dominated by variants with the encryption capability (i.e., 93%). We obtained the first sample using encrypted communication in October 2007.
When IRC bots are analyzed in more detail, one observes that the channel topic is base64-encoded 13% of the time. During the time in which the samples were executed in Anubis, we also collected over 13,000 real commands that the bot master sent to malware under analysis. In 88% of the cases, the commands were instructing the client to download some file (e.g., get and download commands). Some other interesting commands that we observed were ipscan, login, keylog, scan, msn, and visit.
We also analyzed how many samples tried to disguise their activities by using standard protocols on non-standard ports. For the HTTP bots, 99.5% of the samples connected to the ports 80 and 8080. Only 62 samples were using non-standard ports. However, for the IRC bots, the picture is quite different. 92% of the samples were connecting to an IRC server running on a non-standard port. For example, the ports 80 and 1863 (i.e., Microsoft Messenger) are very common alternatives, often used to bypass firewalls.
Finally, we can classify the 1,719 Storm samples that have been submitted to Anubis into two classes: variants that use encrypted communication channels, and those that do not support encryption. As far as the decryption key is concerned, we only observe one symmetric key consistently being used to encrypt Storm traffic.
|
Another interesting aspect of malware behavior is its capability to detect the presence of an analysis environment such as Anubis. Dynamic analysis systems are a popular means to gather data about malicious code, and it is not surprising that malware is using techniques to thwart such analysis. When a malware program detects a sandbox, it typically alters its behavior - most of the time, it just quits. In this section, we attempt to estimate the number of samples that use (general and Anubis specific) anti-sandbox techniques.
Sandbox detection techniques fall into two main classes: One class is comprised of instruction-level detection techniques, which are techniques that determine the difference between a real CPU and an emulated one by only making use of CPU instructions. The second class are API-level detection methods, which query the environment by calling one or several (Windows) API functions.
Unfortunately, we have currently no good way to detect instruction-level detection attempts. While it is theoretically possible to monitor single instructions in a full system emulator, for performance reasons, Anubis essentially works at the API (and system call) level. Since Anubis leverages Qemu for its full system emulation, it is susceptible to the same detection methods as Qemu is. In particular, several of the detection strategies (all of them are instruction-level detections) outlined in [9] and [15] also work for Anubis.
Since we do monitor Windows API calls, we are in a better position to check for possible API-level detection methods. At the time of writing this paper, several Anubis-specific detections have been published [2] on the Internet. All of them work by comparing the return value of a Windows API function such as GetComputerName to a a hard-coded value that is known to identify Anubis. Our system includes a data tainting component that allows us to detect when the output of an interesting function is subsequently used as an operand in a comparison operation [4]. Thus, we were able to analyze our sample set for specific comparisons that represent known Anubis checks published in forum postings or blogs. Table 6 summarizes our findings. A couple of checks deserve more discussion. Our system names each analyzed sample sample.exe. Thus, a well-known Anubis detection routine compares the return value of the Windows API function GetCommandLine with that string. Similarly, in the past, every sample was executed as a Windows user with the name ``user.'' Consequently, it was possible to compare the result of NtQuerySystemInformation with the string ``user'' to detect Anubis (as a side note, we have since changed this username to ``Administrator'').
In total, we have found that only 0.03% of the samples (99 distinct malware programs) contain a known Anubis check. Most of these samples perform the check in the beginning of their execution, and immediately exit if they detect the presence of our sandbox. Of course, it is possible that malware samples perform a wide range of other checks. Moreover, as mentioned previously, we have no good way to identify instruction-level detections or timing-based detection attempts. Thus, the reported numbers are a clear lower bound.
Under the assumption that a sample that detects Anubis (or a sandbox) does not perform much activity, we can also provide an upper bound for the samples that do sandbox detection. Based on our experience with Anubis, we consider a behavioral report (a profile [4]) to contain ``not much activity'' when it contains less than 150 features. For comparison, the average profile has 1,465 features. Using this definition, we found that 12.45 % of the executable samples (13.57 % of the clusters) show not much activity.
Of course, not of all these samples really contain anti-sandbox routines, as there are multiple reasons why Anubis might not be able to produce a good report. For example, GUI programs that require user input (such as installers) cannot be analyzed sufficiently. Anubis only has a very limited user input simulation, which simply closes opened windows. Moreover, some programs require non-existing components at runtime (note, though, that programs that fail because of unsatisfied, static DLL dependencies are not included in the 12.45 %). In addition, at least 0.51% of the reports with not much activity can be attributed to samples that are protected with a packer that is known to be not correctly emulated in Qemu (such as Telock and specific packer versions of Armadillo and PE Compact). Last but not least, bugs in Anubis and Qemu are also a possible cause.
Malware is one of the most important problems on the Internet today. Although much research has been conducted on many aspects of malicious code, little has been reported in literature on the (host-based) activity of malicious programs once they have infected a machine.
In this paper, we aim to shed light on common malware behaviors. We perform a comprehensive analysis of almost one million malware samples and determine the influence of code polymorphism on malware statistics. Understanding common malware behaviors is important to enable the development of effective malware countermeasures and mitigation techniques.
This work has been supported by the European Commission through project FP7-ICT-216026-WOMBAT, by FIT-IT through the Pathfinder project, by FWF through the Web-Defense project (No. P18764) and by Secure Business Austria.
This document was generated using the LaTeX2HTML translator Version 2002-2-1 (1.71)
Copyright © 1993, 1994, 1995, 1996,
Nikos Drakos,
Computer Based Learning Unit, University of Leeds.
Copyright © 1997, 1998, 1999,
Ross Moore,
Mathematics Department, Macquarie University, Sydney.
The command line arguments were:
latex2html -split 0 -show_section_numbers -local_icons -no_navigation stats.tex
The translation was initiated by Ulrich Bayer on 2009-03-31