To understand how load affects response time, we measure latencies at
various requests rates. Each server's maximum capacity is determined
by having all clients issue requests in an infinite-demand
(saturation) model, which is defined as load level of 1, and then
relative rates are reported as load fractions relative to the infinite
demand capacity of each server. This process simplifies comparison
across servers, though it may bias toward servers with low
capacity. Response time is measured by recording the wall-clock time
between the client starting the HTTP request and receiving the last
byte of the response. We normally report mean response time, but we
note that it can hide the details of the latency profiles, especially
under workloads with widely-varying request sizes. So, in addition to
mean response time, we also present the ![]() ,
, ![]() (median)
and
(median)
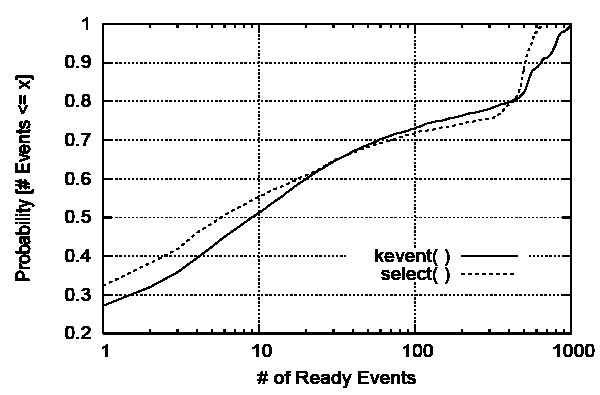
and ![]() percentiles of the latency distribution. Where
appropriate, we also provide the cumulative distribution function
(CDF) of the client-perceived latencies.
percentiles of the latency distribution. Where
appropriate, we also provide the cumulative distribution function
(CDF) of the client-perceived latencies.