Monitoring network services and diagnosing their problems often require active probing methods. Current probing methods, however, are becoming unreliable, because of interferences from various middleboxes, and inadequate due to their limited path metrics support. In this paper, we present the design and implementation of OneProbe, a new TCP probing method for reliable and metric-rich path monitoring. We have implemented HTTP/OneProbe (i.e., OneProbe for HTTP) which sends TCP data probes containing legitimate HTTP requests to induce HTTP responses for path measurement. Since the probing method is based on TCP's basic data transmission mechanisms, OneProbe works correctly on all major operating systems and web server software, and on 93% of the 37,874 websites randomly selected from the Internet. We also successfully deployed HTTP/OneProbe to monitor a number of network paths for over a month and obtained interesting and useful measurement results.
The ability of measuring a network path's quality is important for monitoring service level agreement, choosing the best route, diagnosing performance problems, and many others. This paper considers active measurement methods that do not require the remote endpoint's cooperation in terms of setting up additional software. A non-cooperative method therefore measures the path quality solely based on the response packets induced by its probes. Compared with cooperative methods, non-cooperative methods offer the potential advantage of monitoring a large number of paths from a single system.
The design and implementation of a reliable non-cooperative method is very challenging for the Internet landscape today. A main challenge is to obtain reliable measurement in the midst of interferences from various middleboxes. By reliability, we mean three specific requirements. First, the method can always induce the expected response packets from the remote endpoints, regardless of their operating systems, for path measurement. Second, the method can measure the path quality experienced by data packets. Third, the method can support an adequate sampling rate and sound sampling patterns for obtaining reliable measurement samples.
However, the most practiced measurement methods are not reliable according to our definition. Most notably, routers and end hosts do not always respond to ICMP Ping and Traceroute [24]. Even when ICMP packets are returned, the Ping measurement results may not be trustworthy [38], because the ICMP packets and TCP data packets are processed on different paths in routers. The same can also be said for the probe and response packets that are TCP SYNs, TCP RSTs, and TCP ACKs (pure TCP acknowledgment packets). Other middleboxes, such as accelerators, traffic shapers, load balancers, and intrusion detection systems, can further increase the measurement inaccuracy. A related problem is that their sampling rates cannot be too high.
Another motivation for this work is that an existing non-cooperative method usually supports a very limited number of path metrics. As the quality expected from network paths could be different for various applications, it is necessary to measure the path quality using as many metrics as possible. There are three specific shortcomings responsible for the current limitation. First, many methods, such as Ping, can only measure round-trip path quality. Second, almost all methods (with the exception of tulip [26]) only support one or two types of metrics (e.g., sting [34] for packet loss and POINTER [25] for packet reordering). Third, all methods cannot measure path metrics with different response packet sizes (e.g., sting measures reverse-path packet loss using only TCP ACKs).
Our approach to tackling the reliable path monitoring problem is to conduct measurement in a legitimate TCP application session and to use TCP data packets for the probe and response packets. We avoid using the TCP ACKs returned from the remote endpoints for measurement, because some systems do not return them. Moreover, TCP ACKs are not reliable, and their packet size cannot be changed. Using TCP data packets for the probe and response packets resolves all three problems.
The new TCP data probe is also capable of measuring multiple path metrics-round-trip time (RTT), forward-path and reverse-path packet loss rates, and forward-path and reverse-path packet reordering rates-all at the same time from the same probe. Therefore, we call this new TCP probing method OneProbe: the same probe for multiple path metrics. Although tulip also measures multiple metrics, it cannot measure some packet loss scenarios [26]. Moreover, the tulip probes are different for loss and reordering measurement.
We have implemented HTTP/OneProbe (i.e., OneProbe for HTTP/1.1) which sends legitimate HTTP GET requests in the TCP data probes to induce HTTP response messages for path measurement. Our validation results have shown that the TCP data probes work correctly on all major operating systems and web server software. It also worked on 93% of the 37,874 websites randomly selected from the Internet. We have also enhanced the basic HTTP/OneProbe by using concurrent TCP connections and TCP timestamps option, and improving the process of obtaining sufficient HTTP responses for continuous measurement.
TCP Sidecar [35,36], a measurement platform based on TCP, is closest to our work regarding the requirement of evading middleboxes' interferences. TCP Sidecar's approach is to inject probes into an externally generated TCP flow. Since the focus of TCP Sidecar is to provide a platform for unobtrusive measurement, it does not provide a new probing method to its "passengers." OneProbe, on the other hand, establishes a new TCP flow for measurement and customizes TCP data probes for measuring multiple path metrics.
[ 1.] This paper explains why the existing non-cooperative measurement methods are becoming unreliable and inadequate for the Internet today and proposes to use TCP data probes for reliable and metric-rich path measurement.
[ 2.] This paper proposes a new TCP probing method called OneProbe which sends two TCP data packets to measure multiple path metrics. The correctness of the probe responses was validated on operating systems, web server software, and websites.
[ 3.] This paper describes the implementation details of HTTP/OneProbe, such as the method of obtaining suitable http URLs for measurement and using HTTP/1.1's request pipelining to facilitate continuous measurement in a persistent HTTP connection.
[ 4.] This paper prescribes three enhancements to the basic HTTP/OneProbe: improving the process of inducing HTTP responses, using TCP timestamps option to enhance the measurement, and employing concurrent TCP connections to support a higher sampling rate and different sampling patterns.
[ 5.] This paper presents testbed experiment results for evaluating HTTP/OneProbe's performance and measurement accuracy, and our measurement experience of monitoring network paths for over a month using HTTP/OneProbe and other tools.
Since OneProbe measures RTT, packet loss, and packet reordering in an legitimate TCP session, it is mostly related to several non-cooperative measurement tools: sting, POINTER, tulip [26], and TCP sidecar.
OneProbe overcomes sting's two main shortcomings for loss-only measurement: unreliability due to anomalous probe traffic and a lack of support for variable response packet size. The probe packets in sting may be filtered due to their highly unusual patterns (a burst of out-of-ordered TCP probes with zero advertised window). The reverse-path loss measurement based on TCP ACKs may be under-estimated for a larger packet size [15]. We recently evaluated sting on the set of 37,874 websites with the two probe packet sizes considered in [34]. With the 41-byte probes, the sting measurement was unsuccessful for 54.8% of the servers; the non-success rate for the 1052-byte probes was even close to 100%.
OneProbe overcomes POINTER's two similar shortcomings for reordering-only measurement. The first two POINTER methods (ACM and SAM1) send TCP probe packets with unacceptable acknowledgment numbers (ANs) and sequence number (SNs) to induce TCP ACKs for measurement. Therefore, the probes could be considered anomalous, and the response packet size cannot be changed. The third method (SAM2), on the other hand, sends probes with acceptable SNs but the ANs become unacceptable if the probe packets are reordered.
Tulip, being a hop-by-hop measurement tool, was designed to localize packet loss and reordering events on network paths, and to measure queueing delay. Tulip's loss and reordering measurement, however, is based on the unwarranted assumption that the remote hosts and routers support consecutive IPID (IP's identification) values. We tested tulip using the same set of web servers for sting. In our experiments, tulip measured the last hops of the paths. The tests were unsuccessful for 80% of the servers for loss and reordering measurement-50% of them failed to respond to tulip's UDP probes, and another 30% failed to return consecutive IPID values.
TCP Sidecar provides support for injecting measurement probes in a non-measurement TCP connection. The probes are limited to TCP ACKs and replayed TCP data packets, because they must not interfere with the normal data transmissions in the TCP connection. As a result, the probes do not measure all packet loss scenarios and packet reordering. Due to the same reason, the sampling pattern and rate cannot be controlled, because a probe is sent only after the connection is idle for some time (e.g., 500 milliseconds in [36]).
OneProbe is a new probing method operating at the TCP layer. Each probe consists of two customized TCP data packets to induce at most two new TCP data packets from the remote endpoint for path measurement. Moreover, the probe and response packets carry legitimate application data, so that the remote side will perceive the probe traffic as coming from a legitimate application session. In a client-server application protocol, the probes usually carry application requests, and the response packets contain the requested objects. Therefore, an OneProbe implementation comprises two main components: OneProbe and a TCP application-dependent component.
OneProbe can be implemented for any TCP application protocol that provides support for requesting data from the remote endpoint. This paper presents HTTP/OneProbe (HTTP/OP in short), an OneProbe implementation for HTTP/1.1 [33]. Figure 1 shows the main components of HTTP/OP. An HTTP/OP user inputs an http URL, and the probe and response packet sizes (measured in terms of the IP packet size). The HTTP helper, an application-dependent component, first comes up a set of qualified URLs for the specified packet sizes and then prepares the corresponding HTTP GET messages. The user may also specify the sampling pattern and rate which, together with the HTTP GET messages, are used for OneProbe measurement at the TCP layer.
Figure 1: The main components of HTTP/OneProbe.
The probe is the result of several design choices. The first advantage of using TCP probes (instead of application-layer probes) is that the same probing mechanism could be implemented for many TCP application protocols. TCP probes can also provide more accurate measurement about the network path quality than higher-layer probes. Moreover, using two packets is a minimum requirement for packet reordering measurement. For loss measurement, the second packet can help determine where-the forward path (from OneProbe to the remote endpoint) or the reverse path-the first packet is lost.
Another key issue in the probe design is what kind of response packets to induce from the remote endpoint. To measure the reverse-path quality with the same types of metrics, the probe is designed to induce at most two new TCP data packets from the remote endpoint. These two response packets are used for measuring the reverse-path quality in a similar way as the two probe packets for the forward-path quality. Furthermore, the response packets are distinguishable for almost all possible delivery statuses of the probe and response packets. As a result, OneProbe can measure both forward-path and reverse-path quality primarily based on the response packets.
HTTP/OP sends a sequence of probes in a persistent HTTP connection (over a single TCP connection). Each probe packet contains a legitimate HTTP request, and each response packet contains legitimate data requested by HTTP/OP. To focus on the probing process in this section, we temporarily ignore the application-level issues and assume that the TCP server always has enough application data to send back to HTTP/OP. We also postpone the explanation on how OneProbe can set the user-specified packet sizes to section 4.
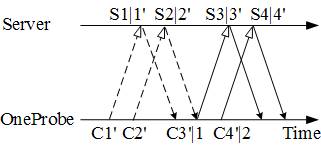
We use Figure 2 to explain the probing process. Denote a probe packet by Cm|n and a response packet by Sm|n. Both packets are TCP data packets, and m and n are the TCP data segment's SN and AN, respectively. All the TCP data segments considered in this paper are of full size (i.e., the maximum segment size, MSS). Therefore, we simply use m = 1, 2, … to enumerate the server's TCP data segments and 1’, 2’, … OneProbe's TCP data segments. For example, OneProbe sends its fourth data segment in C4’|2 that also acknowledges the first two data segments from the server. Moreover, when the AN is not important, we just use Cm and Sm.
OneProbe customizes and dispatches the successive probes according to the following three rules:
[ P1.] (Dispatching a new probe) A new probe is dispatched only after receiving two new data segments from the server and the acknowledgment for the data segments in the probe.
[ P2.] (Acknowledging one data segment) Each probe packet acknowledges only one data segment from the server, although both have been received by the time of sending the first probe packet.
[ P3.] (Controlling the send window size) The probe packets advertise a TCP receive window of two segments in an attempt to constrain the server's TCP send window size to two segments.
Figure 2 depicts two successive probe rounds (the first round denoted by dotted lines and the second by solid lines). According to P1, OneProbe sends a new probe of {C3’|1, C4’|2} (for a new probe round) after receiving S1|1’ and S2|2’. Therefore, the packet transmissions in the first round do not overlap with that in the next. Moreover, if the server's congestion window size (cwnd) is at least two segments, P3 will ensure that its send window size is set to two segments. Finally, based on P2 and P3, the server can send only one new data segment after receiving a probe packet if the probe packets are received in the original order.
Figure 2: Two successive probe rounds in OneProbe.
Although OneProbe manipulates the TCP packet transmissions according to P1-P3, there are no apparent anomalies existing in the probe packets. It only appears to the server that the client has a low receive buffer, and its send window is always full. Moreover, according to our measurement experience, the OneProbe transmission pattern was not construed for an anomalous TCP flow. We received only a couple of complaints about our measurement activities for the past two years; one of them came from a website that normally received very few external requests.
OneProbe measures the RTT based on a probe packet and its induced new data packet (e.g., C3’|1 and S3|3’ in Figure 2). Therefore, in the absence of packet loss, OneProbe normally obtains two RTT observations in a probe round. However, OneProbe uses only the first-probe-packet-RTT for measurement, because the second probe packet's RTT may be biased by the first packet [10].
There are five possible path events regarding the two probe packets on the forward path:
[ F0.] Both probe packets arrive at the server with the same order.
[ FR.] Both probe packets arrive at the server with a reverse order.
[ F1.] The first probe packet is lost, but the second arrives at the server.
[ F2.] The first probe packet arrives at the server, but the second is lost.
[ F3.] Both probe packets are lost.
There are also five similar events for the two new response packets on the reverse path: R0, RR, R1, R2, and R3 (by replacing "probe" with "response" and "the server" with "OneProbe" in the list above). As a result, there are 18 possible loss-reordering events, as shown in Table 1: the 17 events indicated √ and one event for F3 (there is no √, because this is a forward-path-only event). Others indicated by - are obviously not possible.
Table 1: The 18 possible loss-reordering events for the two probe packets and two response packets.
OneProbe can detect almost all the 18 path events based on the response packets. Considering the {C3’|1, C4’|2} probe in Figure 2, Table 2 summarizes the response packets induced for the 18 cases based on RFC 793 [20]. In addition to the new data segments 3 and 4, the server may retransmit old data segments 1, 2, and 3, and we use [^(S)]m|n to refer to a data retransmission. Since the server responses are based on TCP's two basic mechanisms: acknowledgment-clocked transmissions and timeout-based retransmissions, all operating systems are expected to produce the same responses.
Figure 2 has already illustrated the event F0×R0; Figure 3 (C1’ and C2’ are omitted) illustrates four other cases: FR×R0, F1×R0, F2×R0, and F3. The rest can be easily constructed from the illustrations for these five events. Note that, because of P1, the server retransmits old data segments in all four cases. The main purpose for withholding a new probe, even after receiving two new data segments (e.g., in the events FR×R0 and F1×R0), is to induce retransmissions for path event differentiation.
Table 2: The response packets induced by the {C3’|1, C4’|2} probe for the 18 path events according to RFC 793.
|
1st response |
2nd response |
3rd response |
|
|
|
packets |
packets |
packets |
|
1. F0×R0 |
S3|3’ |
S4|4’ |
- |
|
2. F0×RR |
S4|4’ |
S3|3’ |
- |
|
3. F0×R1 |
S4|4’ |
[^(S)]3|4’ |
- |
|
4. F0×R2 |
S3|3’ |
[^(S)]3|4’ |
- |
|
5. F0×R3 |
[^(S)]3|4’ |
- |
- |
|
6. FR×R0 |
S3|2’ |
S4|2’ |
[^(S)]3|4’ |
|
7. FR×RR |
S4|2’ |
S3|2’ |
[^(S)]3|4’ |
|
8. FR×R1 |
S4|2’ |
[^(S)]3|4’ |
- |
|
9. FR×R2 |
S3|2’ |
[^(S)]3|4’ |
- |
|
10. FR×R3 |
[^(S)]3|4’ |
- |
- |
|
11. F1×R0 |
S3|2’ |
S4|2’ |
[^(S)]3|2’ |
|
12. F1×RR |
S4|2’ |
S3|2’ |
[^(S)]3|2’ |
|
13. F1×R1 |
S4|2’ |
[^(S)]3|2’ |
- |
|
14. F1×R2 |
S3|2’ |
[^(S)]3|2’ |
- |
|
15. F1×R3 |
[^(S)]3|2’ |
- |
- |
|
16. F2×R0 |
S3|3’ |
[^(S)]2|3’ |
- |
|
17. F2×R1 |
[^(S)]2|3’ |
- |
- |
|
18. F3 |
[^(S)]1|2’ |
- |
- |
Figure 3: OneProbe's packet transmissions for the path events FR×R0, F1×R0, F2×R0, and F3×R0.
The different combinations of the SN and AN in the response packets enable OneProbe to distinguish almost all the 18 path events. It is not difficult to see, by sorting Table 2 according to the three response packets, that each sequence of the response packets matches uniquely to a path event, except for the following three cases:
[ A1.] F1×R2 and F1×R3: These two events cannot be distinguished based on the response packets, because S3|2’ and [^(S)]3|2’ are identical, and the server may retransmit more than once.
[ A2.] F1×RR and F1×R1: The reasons for their indistinguishability are similar to that for A1.
[ A3.] F0×R3 and FR×R3: Both events have the same response packet [^(S)]3|4’.
The ambiguities in A1 and A2 make the delivery status of S3|2’ uncertain. The ambiguity in A3, on the other hand, makes the probe's order of arrival uncertain. Our current implementation disambiguates A1 and A2 by measuring the time required for S3|2’ (or [^(S)]3|2’) to arrive. It usually takes a much longer time to receive [^(S)]3|2’, the retransmission of S3|2’.
Recall that an important design choice for OneProbe is not to rely on TCP ACKs. However, some ACKs, if received by OneProbe, can assist in detecting the path events. There are two such ACKs: out-of-ordered-packet ACK (OOP-ACK) and filling-a-hole ACK (FAH-ACK). Referring to Figure 3(a), the early arrival of C4’|2 could immediately trigger an OOP-ACK, whereas the late arrival of C3’|1 could immediately trigger an FAH-ACK. According to our measurement, some systems did not return the OOP-ACK, but all the systems tested returned the FAH-ACK.
Even though the system responses regarding the FAH-ACK are uniform, OneProbe still does not rely on it for measurement, because it could be lost. Instead, OneProbe exploits these ACKs, if received, to enhance its measurement. The first is using the FAH-ACK to accelerate the detection of the forward-path reordering events (i.e., FR×∗) without waiting for the data retransmissions. The second is using the FAH-ACK to disambiguate A3 that is the only unresolved case. An arrival of FAH-ACK, in addition to [^(S)]3|4’, clearly signals an FR×R3 event.
Out of the 18 path events, only the path events 1-2 fulfill the conditions for dispatching a new probe in P1 immediately after receiving two response packets. Moreover, path events 3 and 6-8 fulfill the conditions immediately after receiving a data retransmission. However, the condition is not met for the rest (i.e., events 4-5 and 9-18). Another related problem is that the server's cwnd is dropped to one segment for all the path events that involve timeout-based retransmissions (i.e., path events 3-18).
To address the two problems that prevent OneProbe from starting a new probe round, OneProbe will first send one or more new TCP ACKs to increase the server's cwnd back to two for path events 3-18. After receiving two new data segments, OneProbe dispatches a new probe: {C5’, C6’} for events 3-10, {C4’, C5’} for events 16-17, and {C3’, C4’} for event 18. Handling events 11-15 is more complicated. If a new probe of {C3’, C4’} were used, the server will drop C4’, because it has already been received. The current implementation restarts the connection when encountering these path events. A better approach is to retransmit C3’ with the respective ANs and to use a new probe of {C5’, C6’}.
OneProbe samples the packet loss and reordering rates from consecutive probe rounds. Similar to the RTT measurement, OneProbe uses only the first packet for the loss measurement. After conducting a number of consecutive probe rounds, say 120, over one minute, OneProbe computes the forward-path (and reverse-path) loss rate by dividing the number of the first-probe-packet-loss events (and the first-response-packet-loss events) by 120. OneProbe computes the packet reordering rates in a similar manner.
We have implemented HTTP/OP as a user-level tool (around 8000 lines of C code) on unmodified Linux 2.6 kernel. As shown in Figure 1, HTTP/OP consists of two main components: HTTP helper and OneProbe. HTTP helper handles the issues concerning the HTTP 1.1 protocol, whereas OneProbe implements OneProbe. This section considers a basic HTTP/OP that utilizes a persistent HTTP/1.1 connection.
The HTTP helper's main tasks include finding one or more qualified http URLs for the user-specified packet sizes and preparing the HTTP GET requests for them. Figure 4 shows that HTTP/OP sends an initial HTTP GET request for a qualified url-1 in C0’. The server replies with an HTTP response message sent in S1, S2, …. HTTP/OP also sends the same request in all subsequent probe packets. Note that before sending the first probe {C1’, C2’}, HTTP/OP sends an ACK to ramp up the server's cwnd to two segments. Therefore, C0’ and S1-S3 are not used for OneProbe measurement.
Figure 4: HTTP/OP sends HTTP GET requests for url-1 for OneProbe measurement.
An http URL is considered qualified if its HTTP GET request can be retrofitted into a probe packet, and the GET request can induce at least five response packets from the server. A minimum of five response packets is required because of the three additional response packets for the cwnd ramp-up. Let Zp and Zr be the user-specified probe packet size and response packet size, respectively. Therefore, the length of the HTTP GET request for a qualified URL will not exceed Zp−40 bytes (assuming a 40-byte TCP/IP header). Moreover, the length of corresponding HTTP response message, including the response header and message body, must be at least 5 ×(Zr−40) bytes.
Checking the length of the GET request is simple. Verifying whether a user-specified URL meets the size requirement for the response packets, however, requires some work. If the Content-Length header field is present in the HTTP response message, the length is just a sum of the field value and the response header's length. Otherwise, the helper will download the entire HTTP response message to determine the length. If no qualified URL can be obtained, the helper will perform web crawling to retrieve all the available URLs, starting at the root of the web server and down to a certain depth level (five for our case). Our implementation for the web crawling process is based on the recursive retrieval technique implemented in Wget [17].
Besides, the HTTP GET request for a qualified URL must induce a 200(OK) response. We purposely do not use those with 404(Not Found) responses in order not to cause security alerts on the site. We also avoid using HTTP response messages that do not have a message body (e.g., 304(Not Modified)).
To craft a Zp-byte probe packet for an HTTP request, the helper expands the packet size through the Referer field. Since some web servers only accept requests referred from their own web pages, the helper first appends the requested URL to the Referer field to avoid blocking. If the packet size still falls short, the helper further appends a customized string consisting of a probe ID and an email address for our project (for lodging a complaint [18]) repeatedly until reaching the packet size. Moreover, to reduce the delay in dispatching the probes due to possible context switching, the HTTP helper has prepared the HTTP GET requests for the qualified http URLs before starting the OneProbe measurement.
HTTP/OP exploits HTTP/1.1's request pipelining to include a GET message in each probe packet for path measurement. The pipelined HTTP GET requests could be for a single or multiple URLs. There are also other alternatives, such as sending a large GET message in several probe packets or including multiple GET messages in a probe packet. But we did not adopt them, because they are either delaying the return of the response packets or introducing too many request messages.
Moreover, an HTTP response message usually will not fully occupy the last response packet. Therefore, a full-sized response packet may contain data from two HTTP response messages. However, we have also observed that some response packets are not full-sized packets, because they contain only the last chunks of the response messages. Our current implementation will close the connection whenever detecting a small segment and ignore the probe rounds involving small segments. A better approach is perhaps to continue the next probe round using the next HTTP response message in the same connection.
OneProbe manages the measurement in two levels: session and TCP connection. An OneProbe session could involve concurrent TCP connections (see section 5.3 for this enhancement). Figure 5 shows OneProbe's main tasks for a TCP connection in two consecutive phases: preparation and probing. The preparation phase is for performing the ground works for the probing phase. In the probing phase, OneProbe dispatches the probes containing the HTTP GET requests that have been prepared by the HTTP helper, analyzes the response packets, and terminates the connection when the session ends or encounters exceptions. OneProbe also includes a diagnosis module to detect self-induced packet losses.
Figure 5: OneProbe's major tasks in the preparation and probing phases for a TCP connection.
There are two mains tasks in the session management. The first task is that OneProbe establishes and maintains a system-configurable number of TCP connections for a measurement session (one connection for the basic HTTP/OP). As a second task, OneProbe prepares a probe schedule according to the user-specified sampling pattern and rate before starting the measurement. The schedule contains a list of probe tasks, each of which includes a dispatch time and a probe number. The probe tasks are enqueued to a probe-schedule queue as soon as they are generated. OneProbe currently supports periodic and Poisson sampling, and it is not difficult to admit others. For the Poisson sampling, our implementation is based on the method 3 in RFC 2330 [31] which eliminates possible timing errors in dispatching the probes.
OneProbe configures the probe and response packet sizes during the TCP three-way handshake. OneProbe advertises its MSS (say MSSc) in the TCP SYN segment to control the size of the server's response packets. From the TCP SYN/ACK segment returned by the server, OneProbe learns the server's advertised MSS (say MSSs). As a result, Zp must be less than MSSs+40 bytes, and Zr = min{MSSc, MSSs}+40 bytes. Therefore, OneProbe can dictate the server's response packet size by advertising an MSSc < MSSs.
Another purpose of this phase, as already shown in Figure 4, is to ramp up the server's cwnd to two segments for starting the first probe round. If the server's initial cwnd is at least two segments (detected by receiving two response packets after the initial HTTP GET request), then the first probe round can be started without sending the ACK.
Preparing for the probes The probing phase starts as soon as receiving two response packets from the server (see Figure 4). To dispatch a probe, OneProbe first retrieves a probe task from the probe-schedule queue. Moreover, any slipped probe task, for which its dispatch time has already passed the current time, will be removed from the queue and discarded. When the probe schedule is empty, OneProbe closes the TCP connection.
After obtaining a probe task, OneProbe uses clock_nanosleep() in time.h to perform a high-resolution sleep until reaching the dispatch time. Upon waking up, OneProbe draws a pair of HTTP GET requests randomly from the list of the GET requests already prepared by the HTTP helper and sends each in a probe packet. To ensure a successful delivery of the probe to the network, OneProbe captures each dispatched probe packet using libpcap.
Dispatching the probes Similar to other measuring systems, such as Scriptroute [37], we have used Linux raw socket to craft and send the probe packets, and the libpcap 1.0.0 library to capture the probe and response packets. As a result of bypassing Linux's normal TCP/IP processing, the kernel is unaware of OneProbe's TCP connections and will therefore respond with a TCP RST for each response packet received. Our implementation blocks the RST traffic using Linux's iptables.
Another important issue is to timestamp each probe and response packet accurately for the RTT measurement. Since we have already used libpcap to capture packets, we use the timestamp from the pcap_pkthdr structure of each probe and response packet to measure the RTT with microsecond resolution. An alternative is to use the recently proposed TSC clock [14] that provides a highly accurate timing information through the kernel timestamping, but accessing it requires a kernel patch. The user-level timestamp from gettimeofday(), on the other hand, is unreliable, because its accuracy can be affected by system's context switching.
Analyzing the response packets OneProbe captures the response packets (and probe packets) using libpcap and writes all the captured packets to a dump file (which can be opened by pcap_dump_offline() available in the libpcap library) for analysis. OneProbe determines the path event based on the sequence of response packets in Table 2 and the assistance of TCP ACKs discussed in section 3.5. It also measures the first-probe-packet-RTT from the packet timestamps. In processing the response packets, OneProbe also filters packets irrelevant to the measurement, such as TCP window updates. Furthermore, OneProbe computes from a consecutive number of probe rounds the statistical metrics (in terms of, e.g., mean and median) for the RTT, loss rates, and reordering rates.
OneProbe supports both online and offline processing of the response packets. The online processing is possible, because OneProbe only needs to identify the TCP data packet received from the server. However, we have set the default processing to offline mainly for preventing the processing workload from influencing the probing process. Another advantage of the offline approach is to facilitate a more accurate (as compared with the online approach) disambiguation of A1 and A2 based on the RTT samples collected in the measurement (as discussed in section 3.4).
OneProbe performs a self-diagnosis to confirm that the measurement is free of self-induced packet losses. For the forward-path measurement, failures of sending out the probe packets are still possible, despite that the implementation always validates the successful invocation of the sendto() function. To detect these self-induced losses, OneProbe uses libpcap to verify the delivery of each outgoing probe packet to the network. For the reverse-path measurement, self-induced losses could also occur to the response packets due to insufficient buffer space. OneProbe monitors the ps_drop variable returned by the libpcap's pcap_stats() function to detect such losses.
This section describes three enhancements to the basic HTTP/OP presented in the last section. The first enhancement is to improve the process of inducing sufficient HTTP responses. We have implemented additional mechanisms to prevent web servers from compressing the requested objects and to use unqualified URLs for measurement. The second is to disambiguate A3 using TCP timestamps option. The third enhancement is using multiple TCP connections in a measurement session to satisfy the user-specified sampling rate and pattern. With a single TCP connection, the sampling rate is constrained to at most one per RTT, and the RTT variations also make it difficult to realize the user-specified sampling pattern.
Avoiding message compression The first improvement is to prevent web servers from compressing HTTP responses which, for example, is performed by Apache server's mod_deflate module [1]. The compressed responses could affect OneProbe measurement, because the expected number of response packets for a qualified URL may be reduced. Therefore, each HTTP GET request specifies Accept-Encoding: identity;q=1, *;q=0, where identity;q=1 indicates that the identity encoding (i.e., no transformation) should be performed on the entity of the response, and *;q=0 means avoiding other encoding methods.
Using unqualified URLs for measurement As a second improvement, HTTP/OP exploits the range request feature in HTTP/1.1 to use unqualified URLs for path measurement. A range request can be used to request multiple overlapped ranges of the same web object from a web server that accepts range requests. Therefore, even an unqualified URL can be "expanded" to fulfill the minimum size requirement for the response packet.
We have implemented this enhancement in the HTTP helper which can verify whether the server supports the range request via the Accept-Ranges header field in the HTTP response message. If the HTTP helper cannot find any qualified URL but discover that the server supports the range request feature, it will craft a range request as discussed above to induce HTTP response messages for OneProbe measurement.
In addition to the FAH-ACK, we have proposed and implemented a method to disambiguate A3 using the TCP timestamps option [21]. In this enhancement, each probe packet contains a distinct timestamp in the TCP option field. If the server also supports the TCP timestamps option, it will retain the timestamp received from the most recent probe packet that advances its receive window and echo it in its next response packet. Therefore, the server retains C4’'s timestamp for the case of F0×R3 and C3’'s timestamp for the case of FR×R3. As a result, the two path events can be distinguished based on the different timestamps in [^(S)]3|4’.
To extend the basic HTTP/OP to using N TCP connections, we have used the POSIX Threads (pthreads) library to create and manage multiple threads. A single thread is used for managing the measurement session, and N worker threads are created for managing the TCP connections separately. OneProbe also monitors the health of the connections to ensure that there are always N TCP connections available throughout the measurement session.
Since some web servers may limit the number of concurrent TCP connections initiated from an IP address, OneProbe assigns randomly selected source IP addresses from an address pool to the N connections. Our experience shows that N=10 is sufficient for supporting periodic sampling with a rate of two probes per second. A higher N, however, is expected for Poisson sampling because of the high inter-probe delay variability.
This section presents three sets of evaluation results. The first one evaluates whether different systems and web servers respond to OneProbe's probes correctly. The second evaluates how the latency induced by web servers will affect the accuracy of the HTTP/OP measurement. The final set evaluates the effect of the HTTP/OP measurement on the system resource consumption in the measuring system and web servers.
We have designed a small, but just sufficient, suite of validation tests (called Validator) for OneProbe. A system or web server that passes all the tests can be used by OneProbe for path measurement. Table 3 describes the four validation tests V0-V2 that "simulate" the forward-path events F0-F2, respectively. Same as OneProbe, Validator constrains the server's cwnd to two segments. Moreover, Validator does not acknowledge the response data packets in order to simulate reverse-path losses. Therefore, the data retransmissions are expected to be the same as in Table 2. Note that these tests for reverse-path losses have already covered the test for F3, because withholding the next probe is the same as losing it.
Table 3: A suite of four validation tests performed by Validator.
|
Testing |
Expected packets |
Expected data |
|
|
|
probes |
induced from server |
retransmissions |
|
V0. |
{C3’,C4’} |
{S3|3’,S4|4’} |
[^(S)]3|4’ |
|
VR. |
{C4’,C3’} |
{S3|2’,S4|2’} |
[^(S)]3|4’ |
|
V1. |
C4’ only |
{S3|2’,S4|2’} |
[^(S)]3|2’ |
|
V2. |
C3’ only |
S3|3’ |
[^(S)]2|3’ |
We applied Validator to test the major operating systems and web server software listed in Table 4. Three trials were performed for each system and server. A test was considered successful if all four validation tests were passed in at least one trial. The validation results were all successful.
Table 4: The 39 systems and 35 web server software that passed the OneProbe validation tests.
|
FreeBSD v4.5/4.11/5.5/6.0/6.2, Linux kernel v2.4.20/2.6.5/2.6.11/2.6.15/2.6.18/2.6.20, MacOSX 10.4 server, NetBSD 3.1, OpenBSD 4.1, Solaris 10.1, Windows 2000/XP/Vista |
|
|
Systems tested in the Internet: |
AIX, AS/400, BSD/OS, Compaq Tru64, F5 Big-IP, HP-UX, IRIX, MacOS, NetApp NetCache, NetWare, OpenVMS, OS/2, SCO Unix, Solaris 8/9, SunOS 4, VM, Microsoft Windows NT4/98/Server 2003/2008 |
|
Servers tested in our lab.: |
Abyss, Apache, Lighttpd, Microsoft IIS, Nginx |
|
Servers tested in the Internet: |
AOLserver, Araneida, Apache Tomcat, GFE, GWS-GRFE, IBM HTTP Server, Jetty, Jigsaw, LiteSpeed, Lotus-Domino, Mongrel, Netscape-Enterprise, OmniSecure, Oracle HTTP Server, Orion, Red Hat Secure, Redfoot, Roxen, Slinger, Stronghold, Sun Java System, thttpd, Twisted Web, Virtuoso, WebLogic, WebSiphon, Yaws, Zeus, Zope |
In spite of the successful results above, OneProbe may still not be supported on some Internet paths because of middleboxes and customized TCP/IP stacks. We therefore extended the validation tests to websites in the Internet. We ran the Larbin web crawler [6] with slashdot.org as the starting URL (the same method used in [35]) to obtain 241,906 domain names and then randomly selected 38,069 websites from them. Based on the Netcraft database [29], the web servers came from 87 geographical locations, covering the 39 systems in Table 4 and 117 web server software. After excluding 195 of them that reset the TCP connections, we report the results from the remaining 37,874 websites below.
Successful (93.00%) These servers passed all tests.
Failures in the preparation phase (1.03%) These websites failed to return the expected {S1, S2}. Therefore, OneProbe could not start the probing phase.
Failures in test V0 (0.26%) Most websites in this set replied with {S3|4’, S4|4’}, instead of the expected {S3|3’, S4|4’}. That is, they sent response packets after receiving both probe packets.
Failures in test VR (5.71%) Some websites appeared to have received an order-intact probe because of two kinds of response packets received from them: {S3|3’,S4|4’} and {S3|4’, S4|4’}. Another set replied with {S3|3’, S4|3’}; such behavior is similar to the problem of "failure to retain above sequence data" reported in [30]. The final set replied with {S3|2’, S4|2’}, showing that they did not receive the reordered C3’, possibly due to packet drop by firewalls and intrusion detection systems. For example, Cisco IOS firewall drops reordered packets before release 12.4(11)T [13].
Since all the websites that failed test V1 also failed test VR, these failures are classified only under test VR.
A common problem for non-cooperative measurement tools is that their delay measurement could be affected by the remote endpoint's loading. In particular, a busy web server can introduce substantial latency during HTTP transaction processing [8].
We setup a testbed to evaluate the impact of server-induced latency on the HTTP/OP measurement. The testbed consisted of a web server running Apache v2.2.3 and a probe sender where HTTP/OP and other measurement tools resided. Both machines were connected to each other through a router, which ran Click v1.6 [22] in kernel mode to emulate a fixed RTT of 25 milliseconds between them. Each machine, including the router, was equipped with a 1.7GHz Pentium 4 processor with 256MB memory running Linux v2.6.18 and connected to a 100Mbits/s LAN.
By adopting the approach described in [8], we set up two Surge web load generators [7] in separate machines that were directly connected to the web server. We experimented with a light load (20 Surge users from each generator) and a heavy load (260 Surge users from each generator). Each generator generated requests for objects selected from a set of 2000 distinct static files with size ranging from 78 bytes to 3.2MB. We conducted the same set of experiments for HTTP/OP and httping [19]. We included httping, because it is a common HTTP-based ping tool which uses HTTP HEAD and GET requests as probes to induce HTTP responses for RTT and round-trip loss measurement.
We restricted both HTTP/OP and httping to requesting five static text files of 20KB, 200KB, 2MB, 10MB, and 100MB available in the web server. We launched HTTP/OP using 30 TCP connections and periodic sampling with a rate of 20Hz (one probe every 50 milliseconds). All probe and response packets were 240 bytes in length. For httping, we used the default sampling rate of 1Hz and HEAD requests and responses for measurement. The httping's probe and response packet sizes depended on the URL specified in the HTTP request and the corresponding response.
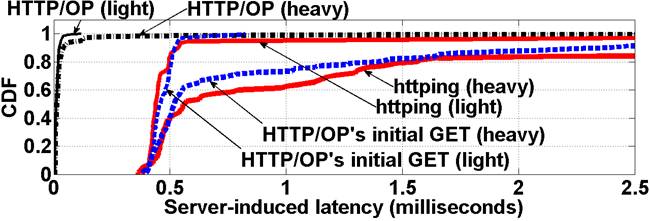
For each load environment, we obtained the server-induced latency by measuring the difference between the arrival time of a probe packet at the server and the time of sending out the response packet that it has induced. Besides for HTTP/OP and httping, we measured the server-induced latency also for the initial HTTP request sent out in the HTTP/OP's preparation phase. As discussed in section 4.1, this request is used for ramping up the server's cwnd, therefore not used for measurement. We installed tcpdump at the server to capture all network traffic to and from the probe sender until we had obtained 150 latency samples for each experiment.
Figure 6 plots the cumulative distribution function (CDF) of the server-induced latency for HTTP/OP, httping, and HTTP/OP's initial HTTP GET request under the light and heavy loads. The figure shows a significant latency occurred to both httping and the initial HTTP GET request. This start-up latency was reported for the Apache 1.3.0 architecture [8]. A similar delay of several milliseconds was also observed for a Google server to send out the first response packet for a request [12].
For the httping and initial HTTP GET request measurement, the server is required to invoke several expensive system calls (such as, read() and stat()) for processing the first request. Using the strace utility [4], we confirmed that the system calls invoked in the user space before sending out the response message was responsible for the start-up latency [2]. Besides, the start-up latency could last even longer because of additional backend server operations (e.g., the query delay of a Google search [12]).
HTTP/OP, on the other hand, avoids the substantial start-up latency, because it does not use the initial HTTP GET request for measurement. Moreover, when the first probe round starts, the response packets can be induced immediately after receiving a new TCP acknowledgment in a probe packet. Therefore, the overhead for the HTTP/OP measurement mainly comes from the data copying between the kernel space and devices. According to the strace results, the overhead of the data copy operations was low, because it was performed by invoking sendfile() to copy data from the file descriptor for the response message directly to a socket interface within the kernel.
Figure 6 also shows a much higher server-induced latency under heavy load for the httping and initial HTTP GET request measurement. The reason is that the server has less system resources for the start-up processing of httping's HEAD request and the initial HTTP GET request. By avoiding the start-up latency, the HTTP/OP measurement is also much less susceptible to the server load, as shown in Figure 6.
Figure 6: Server-induced latency experienced by HTTP/OP, httping, and HTTP/OP's initial HTTP GET request under light and heavy loads.
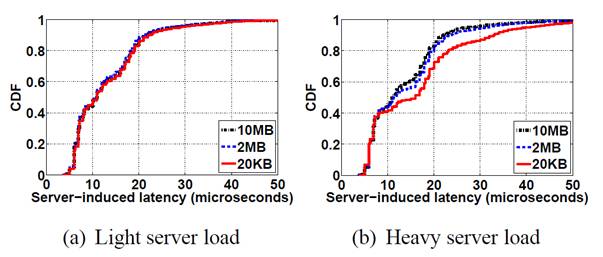
To evaluate the effect of the object size on the server-induced latency, we plot in Figure 7(a) (for light load) and Figure 7(b) (for heavy load) the CDFs of the server-induced latencies for the HTTP/OP measurement based on 4500 samples. For the sake of clarity, we show the results only for 20KB, 2MB, and 10MB. The observations obtained from them also hold for 200KB and 100MB.
Both figures show that the server-induced latency during the HTTP/OP measurement was very small: 80% of the samples were less than 30 microseconds. Therefore, the server-induced latency had negligible effect on the RTT measurement accuracy. Moreover, under a heavy server load, the latency was higher for a smaller object size, because HTTP/OP requested the server to load the requested objects more often. Under a light server load, however, the latency differences for the three object sizes were not significant. As a result, the server loading had more impact on the HTTP/OP measurement for small objects. Similar observations were reported in [8].
Figure 7: CDFs of the server-induced latency experienced by HTTP/OP.
Another important evaluation concerns the amount of system resources consumed by the HTTP/OP measurement in the probe sender and web server. We employed the same testbed but with different parameter settings. The web server hosted ten 61MB tarballs for retrieval. We ran HTTP/OP on the probe sender to randomly request the ten tarballs for 240 seconds using 1, 10, and 100 TCP connections and periodic sampling with five different rates: {1, 5, 10, 50, 100, 150}Hz. The probe and response packets had the same packet size of 1500 bytes.
We used vmstat [3] to measure the CPU and memory utilizations consumed by all Apache processes in the web server every second. At the same time, we measured the utilizations consumed by HTTP/OP in the probe sender. During the measurement, we ensured that no other routine processes were executed on both machines. Table 5 shows that the CPU utilizations were very low in all cases. Even when HTTP/OP used 100 concurrent TCP connections with a fine sampling rate of 150Hz, the average CPU utilizations of the probe sender and web server were still below 0.9% and 1.2%, respectively. The average memory utilizations (not shown here) of the probe sender and web server were also less than 2% and 6.3%, respectively, in all cases.
Table 5: The CPU utilizations consumed in the probe sender and web server during the HTTP/OP measurement.
|
Sampling |
Average CPU utilizations (%) |
||
|
connections |
rates (Hz) |
Probe sender |
Web server |
|
1 |
1 |
< 0.01 |
0.03 |
|
1 |
5 |
0.07 |
0.07 |
|
10 |
10 |
< 0.01 |
0.27 |
|
10 |
50 |
0.07 |
0.70 |
|
100 |
100 |
0.17 |
0.77 |
|
100 |
150 |
0.87 |
1.17 |
We also performed similar experiments for three operating systems used by the web server: FreeBSD 6.2-RELEASE, Linux v2.6.18, and Microsoft Windows XP (SP2), and for three popular web server software with default settings: Lighttpd 1.4.18, Microsoft IIS 5.1, and Nginx 0.5.34. The CPU utilizations consumed by them during the HTTP/OP measurement ranged between 0.08% and 1.05%.
HTTP/OP incurs a small overhead to the probe sender, because it inspects only the TCP headers of the probe and response packets, and does not require saving the entire packet's payload to the disk. Moreover, HTTP/OP applies libpcap's packet filters to capture packets relevant to the path measurement and limits the amount of data captured from a packet.
To measure the network I/O for the HTTP/OP measurement, we conducted the measurement on the same testbed using five TCP connections and periodic sampling with a rate of 5Hz. HTTP/OP requested files of 2MB, 10MB, and 100MB for 240 seconds. The probe and response packet sizes were 1500 bytes. We used the sar utility [5] to measure the network I/O from the web server side in terms of the number of packets per second (pkts/s) and bytes per second.
The results in Table 6 are very close to the expected results of 10 pkts/s (5Hz×2 packets) and 15000 bytes/s (10 pkts/s×1500 bytes/pkt) for both reception (Rcv) and transmission (Tmt). The results are slightly higher than the expected results, because of the additional packets for the TCP connection establishment and termination. Table 6 also shows that the network I/O stays almost the same for different object sizes, because it depends only on the probe and response packet sizes.
Table 6: Network I/O for the HTTP/OP measurement.
|
Rcv |
Tmt |
Rcv |
Tmt |
|
|
sizes (MB) |
(pkts/s) |
(pkts/s) |
(bytes/s) |
(bytes/s) |
|
2 |
11.36 |
11.52 |
15598 |
16508 |
|
10 |
11.35 |
11.52 |
15598 |
16511 |
|
100 |
11.34 |
11.48 |
15590 |
16485 |
This section reports our recent experience of deploying HTTP/OP for Internet path measurement. All the measurement results reported here were obtained from an HTTP/OP deployment at a Hong Kong data center. The full set of results and the measurement setup are available from [11].
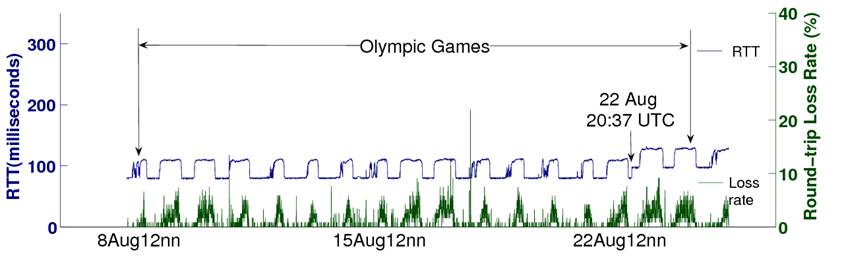
This set of measurement results was obtained from a set of web servers hosting the last Summer Olympic Games. HTTP/OP sent a probe every 500 milliseconds, continuously for one minute, and the same probing pattern repeated after idling for four minutes. The entire measurement was smoothly conducted for over a month.
Figure 8 shows the RTT and round-trip loss rate measurement for one of the paths. The HTTP/OP measurement captured clear diurnal RTT and round-trip loss patterns. The peak loss rates also coincided with the daily high RTT periods. A positive correlation between RTT and loss rate was also reported by observing packet losses at bottleneck queues in a ns-2 simulation study [9]. For temporal correlation, the high RTT periods were longer and the intensity of the peak loss rates were higher on weekends.
Studying the correlation of RTT and packet loss rate is important for predicting network congestion from end hosts [9]. HTTP/OP provides a more accurate measurement of their correlation, because it can sample an Internet path with more fine-grained and uniform sampling, and over a long duration. HTTP/OP's intrusion to the path is also minimal, thus minimizing the self-induced bias. For the purpose of comparison, the measurement in [27] was conducted for five days and for each day each run was executed every two hours, and it introduced between 6 and 20 MB in each run.
Figure 8: Time series of RTT and round-trip loss rates obtained by HTTP/OP for a Summer Olympics web server.
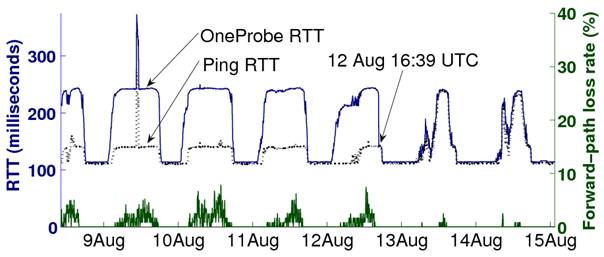
This set of results is also part of the Olympic Games measurement. Besides HTTP/OP, we also deployed ICMP Ping and other tools for path measurement. To compare their results accurately, the tools were configured to measure the same path at the same time. Figure 9 shows the RTT measurement obtained by HTTP/OP and Ping for one of the paths. The figure shows that for the first few days their RTTs consistently differed by around 100 milliseconds on the peaks, but they were similar on the valleys. As a result, the Ping measurement under-estimated the actual RTT experienced by TCP data packets by as much as 70%! Moreover, due to an (possibly network configuration) event unseen to Traceroute, their RTTs "converged" at 12 Aug. 2008 16:39 UTC. At the same time, the forward-path loss rate dropped significantly after this convergence point. Therefore, non-data probes may not measure the actual path quality experienced by data packets.
Figure 9: Discrepancy in the RTT measurement obtained by HTTP/OP and Ping for a Summer Olympics web server.
This set of results is also part of the Olympic Games measurement. For all the paths in this set of measurement, the reverse-path losses dominated the round-trip loss rates, and in some cases the packet losses occurred only on the reverse paths. These results are consistent with web's highly asymmetric traffic profile. Moreover, we conducted a parallel measurement to the same servers but with different reverse paths, but we did not observe packet losses from this set of measurement. Therefore, the packet losses were believed to occur on the reverse paths close to the web servers but not in the web servers.
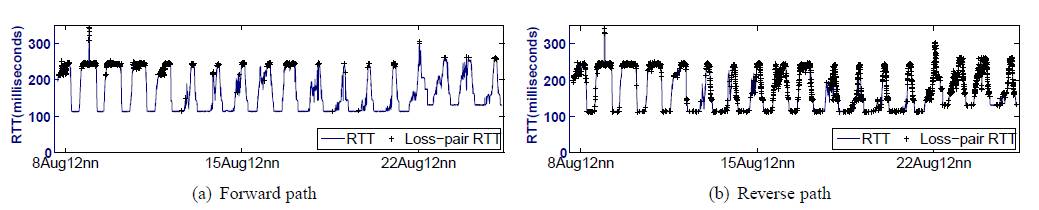
Moreover, HTTP/OP can measure the loss-pair RTT. A probe packet-pair or a response packet-pair is considered a loss pair if only one packet is lost to the pair [23]. Loss-pair analysis has been shown useful in estimating bottleneck buffer sizes of droptail routers and characterizing packet dropping behavior [23]. However, in the absence of a suitable measurement tool, the loss-pair analysis has so far been analyzed using simulations and restricted to round-trip loss pairs.
Figure 10 shows the forward-path and reverse-path loss-pair RTTs for one of the paths, and the RTT was measured for the first packet in the pair (and the second was lost). The loss-pair RTTs are superimposed with the corresponding RTT time series to identify which parts of the RTT time series the loss pairs were located. The figure shows that almost all the loss-pair RTTs on the forward path were clustered on the RTT peaks, suggesting that the packets were dropped in a drop-tail router on the forward path. However, the reverse-path loss-pair RTTs behaved very differently. While many loss pairs saw the highest RTT, there were also many others seeing other RTT values, including the lowest RTT. Therefore, the packet dropping behavior is more similar to that exhibited by a random-early-drop router.
Figure 10: Time series for the loss-pair RTTs obtained by HTTP/OP for a Summer Olympics web server.
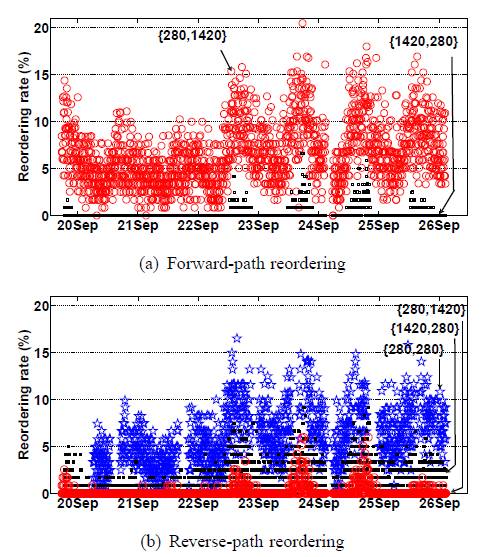
This set of measurement results was obtained from a PlanetLab node [32]. The HTTP/OP measurement revealed that this path experienced persistent, high reordering rates on both forward and reverse paths over one week. We experimented with three combinations of packet sizes: {280,280}, {280,1420}, and {1420,280}, where the first is the probe packet size in bytes and the second response packet size in bytes. Note that the current non-cooperative tools cannot measure the reverse-path reordering rate for different packet sizes.
Figure 11(a) depicts how the packet size affected the reordering rate for the forward path. The reordering pattern for {280,280}, which is not included in the figure, is similar to that for {280,1420}. A comparison of the three results therefore concludes that a smaller probe packet is more prone to packet reordering. This finding is consistent with the results obtained from a cooperative measurement study [16] and TBIT measurement [28].
Figure 11(b) shows the distinctive reordering rates on the reverse path for the three packet size combinations. Same as the forward-path reordering, a smaller response packet size is more prone to packet reordering. Thus, the case of {280,1420} suffered from the least reordering. Surprisingly though, the reordering rate for {280,280} was distinctively higher than that of {1420,280}, although they had the same response packet size. A possible explanation is that smaller probe packets will reach the server with a smaller inter-packet interval. They will therefore induce two response packets also with a smaller interval, and the occurrence of packet reordering generally increases with a shorter inter-packet interval.
Figure 11: Time series of forward-path and reverse-path packet reordering rates obtained by HTTP/OP for a PlanetLab node.
In this paper, we presented OneProbe, a new TCP probing method, and HTTP/OneProbe, an implementation of OneProbe for HTTP/1.1 to induce sufficient HTTP data for continuous measurement. HTTP/OneProbe's path measurement is reliable, because the probes and induced response packets are legitimate HTTP/TCP data packets, and the probes are based on TCP's basic fundamental transmission mechanisms. OneProbe can also sample RTT, packet loss rates on the forward and reverse paths, and packet reordering rates on the forward and reverse paths at the same time using the same probe. We performed extensive experiments to validate the correctness of the probe responses, to evaluate the performance and accuracy of HTTP/OneProbe, and to monitor network paths for over a month. We are currently introducing new path metrics, such as capacity and available bandwidth, to OneProbe.
We thank the five anonymous reviewers for their critical reviews and suggestions and Mike Freedman, in particular, for shepherding our paper. We also thank Waiting Fok for preparing the colorful Internet measurement plots. This work is partially supported by a grant (ref. no. ITS/152/08) from the Innovation Technology Fund in Hong Kong.
Apache: HTTP server project. http://httpd.apache.org/.
Apache Performance Tuning. http://httpd.apache.org/docs/2.2/misc/perf-tuning.html.
procps. http://procps.sourceforge.net/.
strace. http://sourceforge.net/projects/strace.
SYSSTAT. http://pagesperso-orange.fr/sebastien.godard/features.html.
S. Ailleret. Larbin: Multi-purpose web crawler. http://larbin.sourceforge.net/.
P. Barford and M. Crovella. Generating representative workloads for network and server performance evaluation. In Proc. ACM SIGMETRICS, 1998.
P. Barford and M. Crovella. Critical path analysis of TCP transactions. IEEE/ACM Trans. Networking, 9(3), 2001.
S. Bhandarkar, A. Reddy, Y. Zhang, and D. Loguinov. Emulating AQM from end hosts. In Proc. ACM SIGCOMM, 2007.
J. Bolot. End-to-end packet delay and loss behavior in the Internet. In Proc. ACM SIGCOMM, 1993.
R. Chang, E. Chan, W. Fok, and X. Luo. Sampling TCP data-path quality with TCP data probes. In Proc. PFLDNeT, 2009.
Y. Cheng, U. Holzle, N. Cardwell, S. Savage, and G. Voelker. Monkey see, monkey do: A tool for TCP tracing and replaying. In Proc. USENIX Annual Technical Conference, 2004.
Cisco Systems. TCP out-of-order packet support for Cisco IOS firewall and Cisco IOS IPS. http://www.cisco.com/, 2006.
E. Corell, P. Saxholm, and D. Veitch. A user friendly TSC clock. In Proc. PAM, 2006.
S. Floyd and E. Kohler. Tools for the evaluation of simulation and testbed scenarios. Internet-draft draft-irtf-tmrg-tools-05, February 2008.
L. Gharai, C. Perkins, and T. Lehman. Packet reordering, high speed networks and transport protocol performance. In Proc. IEEE ICCCN, 2004.
GNU Wget. http://www.gnu.org/software/wget/.
A. Haeberlen, M. Dischinger, K. Gummadi, and S. Saroiu. Monarch: A tool to emulate transport protocol flows over the Internet at large. In Proc. ACM/USENIX IMC, 2006.
F. Heusden. httping. http://www.vanheusden.com/httping/.
J. Postel (editor). Transmission control protocol. RFC 793, IETF, September 1981.
V. Jacobson, R. Braden, and D. Borman. TCP extensions for high performance. RFC 1323, IETF, May 1992.
E. Kohler. The Click Modular Router Project. http://read.cs.ucla.edu/click/.
J. Liu and M. Crovella. Using loss pairs to discover network properties. In Proc. ACM IMW, 2001.
M. Luckie, Y. Hyun, and B. Huffaker. Traceroute probe method and forward IP path inference. In Proc. ACM/USENIX IMC, 2008.
X. Luo and R. Chang. Novel approaches to end-to-end packet reordering measurement. In Proc. ACM/USENIX IMC, 2005.
R. Mahajan, N. Spring, D. Wetherall, and T. Anderson. User-level Internet path diagnosis. In Proc. ACM SOSP, 2003.
J. Martin, A. Nilsson, and I. Rhee. Delay-based congestion avoidance for TCP. IEEE/ACM Trans. Networking, 11(3), 2003.
A. Medina, M. Allman, and S. Floyd. Measuring the evolution of transport protocols in the Internet. ACM CCR, April 2005.
Netcraft Services. http://uptime.netcraft.com/up/accuracy.html.
V. Paxson, M. Allman, S. Dawson, W. Fenner, J. Griner, I. Heavens, K. Lahey, J. Semke, and B. Volz. Known TCP implementation problems. RFC 2525, IETF, March 1999.
V. Paxson, G. Almes, J. Mahdavi, and M. Mathis. Framework for IP performance metrics. RFC 2330, IETF, May 1998.
PlanetLab. http://www.planet-lab.org/.
R. Fielding et al. Hypertext Transfer Protocol - HTTP/1.1. RFC 2616, IETF, June 1999.
S. Savage. Sting: a TCP-based network measurement tool. In Proc. USENIX Symp. Internet Tech. and Sys., 1999.
R. Sherwood and N. Spring. A platform for unobtrusive measurements on PlanetLab. In Proc. USENIX Workshop on Real, Large Distributed Systems (WORLDS), 2006.
R. Sherwood and N. Spring. Touring the Internet in a TCP sidecar. In Proc. ACM/USENIX IMC, 2006.
N. Spring, D. Wetherall, and T. Anderson. Scriptroute: A public Internet measurement facility. In Proc. USENIX Symp. Internet Tech. and Sys., 2003.
L. Wenwei, Z. Dafang, Y. Jinmin, and X. Gaogang. On evaluating the differences of TCP and ICMP in network measurement. Computer Communications, January 2007.