
Thomas Zimmermann
Microsoft Research
One Microsoft Way
Redmond, Washington, USA
tz@acm.org
Abstract
In an empirical study of 3241 Red Hat packages, we show
that software vulnerabilities correlate with dependencies between
packages. With formal concept analysis and statistical hypothesis
testing, we identify dependencies that decrease the risk of
vulnerabilities (“beauties”) or increase the risk (“beasts”). Using
support vector machines on dependency data, our prediction models
successfully and consistently catch about two thirds of
vulnerable packages (median recall of 0.65). When our models
predict a package as vulnerable, it is correct more than
eight times out of ten (median precision of 0.83). Our
findings help developers to choose new dependencies wisely and make
them aware of risky dependencies.
The efforts by Red Hat are complicated by dependencies between packages. For example, the package mod_php needs to be installed before package mediawiki can be installed, which is why mediawiki depends on mod_php. Sometimes dependencies form long chains or are conflicting, which can cause frustration among users, also known as dependency hell [5].
In this paper, we show that vulnerabilities correlate with dependencies between software packages. For example, when depending on Python the risk of an application being vulnerable decreases, while the risk increases when depending on PHP or Perl. In addition, we demonstrate how to use dependencies to build prediction models for vulnerabilities. More specifically, our contributions are as follows:
Understanding how dependencies correlate with vulnerabilities is important to build safe software. When building new applications, one can choose which packages are dependable. For example, knowing that Python or Gnome applications have been less prone to vulnerabilities in the past, helps to make the right decisions and to minimize risk early. Even if the dependency is unavoidable, one can plan for the increased risk by allocating more resources for quality assurance.
When maintaining existing applications, being aware of dependencies that likely lead to vulnerabilities helps to prioritize resources. Instead of tracking changes and patches for all packages the application depends on, one only needs to track the risky packages.
In the remainder of this paper, we first describe how the data for our experiments was collected (Section 2). We then provide evidence for the correlation of dependencies with vulnerabilities (Section 3) and show how to build models to predict vulnerable packages (Section 4). Next, we explain how to make predictions more descriptive and how to identify fragile packages, i.e., packages that have not yet had vulnerabilities, but soon will have (Section 5). We continue with some hypotheses on why dependencies may influence vulnerabiities (Section 6) and conclude with related work (Section 7) and a discussion of consequences (Section 8).
For the study in this paper, we selected the Red Hat Linux distribution, which consists of several hundred applications bundled in software packages, where each package is in a specific version. Packages are provided in the Red Hat Package Manager (RPM) file format that allows easy download and installation using specific tools. In August 2008, there were 3241 RPMs available from Red Hat.2
To protect its customers, Red Hat issues Red Hat Security Advisories (RHSAs) on the Internet [29]. RHSAs describe vulnerabilities that have been found in packages,3 and how to prevent them. A typical RHSA is shown in Figure 1. On the bottom of every RHSA is a list of packages that need to be updated to remove the described vulnerability from the system. We refer to this as a package having an RHSA. By iterating over all RHSAs, we collected all packages that were linked to vulnerabilities because they had to be updated as part of an RHSA. We also counted for each package by how many RHSAs it was affected; we use this count as the number of vulnerabilities for a package.
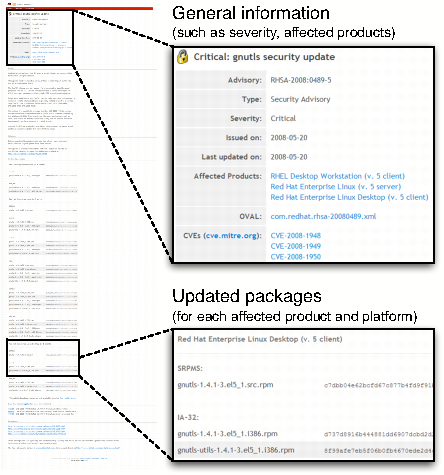
Figure 1: Typical Red Hat Security Advisory
The first RHSA was issued in January 2000. Up until January 2008, there were 1468 RHSAs, which are the primary dataset used for most experiments in this paper (see also Figure 2. The following seven months saw another 178 RHSAs, which we will use as testing set for the prediction of fragile packages (non-vulnerable packages that turn vulnerable) in Sections 5.2 and 5.3. We consider a total of 1646 RHSAs for this paper.4
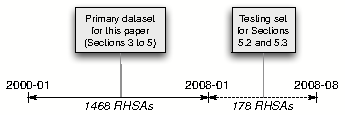
Figure 2: RHSAs used in this paper.
For each package, the RPM file describes which packages are required to be installed. These dependencies are stored in so-called tags (type-value pairs) in the RPM header. Each tag with the type RPMTAG_REQUIRENAME specifies the name of a dependency.5 Extracting dependency information from RPM files is straightforward with the functionality provided by the RPM Library (rpmlib) [3]. For our experiments Josh Bressers of the Red Hat Security Response Team generously provided us with a list of dependencies.
We represent the dependency and vulnerability data as follows. If there are n packages in all, dependency data is represented by an n × n matrix M = ⟨mjk⟩, where
mjk = 1 if package j depends on package k; 0 otherwise. (1)
The row vector mj is also called the dependency vector. The number of dependencies of a package varies from 0 (typically development packages that contain header files and therefore do not depend on other packages) to a staggering 96 (for kdebase), with a median number of 4. The number of dependencies per package looks to be exponentially distributed with a long tail.
Vulnerability information is represented by a vector v with n components where
vk = number of known vulnerabilities in package k.
We call vj the associated vulnerability value for a dependency vector mj. At the time of writing, there were 1133 packages with and 2108 packages without vulnerabilities. The vulnerable packages were updated a total of 7313 times because of security flaws. The number of updates (RHSAs) per package looks to be exponentially distributed with a long tail (see Figure 3; note the logarithmic y-axis): Many packages needed to be updated only once (332 packages), but 801 packages needed more than one update. The most frequently updated packages were kernel and kernel-doc with 129 RHSAs. The next most frequently mentioned package was kernel-smp with 112 RHSAs. The packages php-pgsql, php, php-ldap, php-mysql, php-odbc, and php-imap were mentioned in 51 RHSAs.
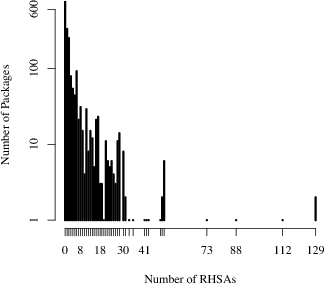
Figure 3: Distribution of RHSAs
In a first experiment, we applied formal concept analysis (FCA) [10] to the dependency and vulnerability data. FCA takes a matrix as input (in our case M) and returns all maximum blocks. Each block B consists of two sets of packages O and A. The set O contains the packages that depend on all packages in set A, or more formally:6
∀ o ∈ O: ∀ a ∈ A: moa = 1
Being a maximum block means, there is no true superset of O for which each package depends on all packages in A and there is no true superset of A on which each package in O depends on.
∄ O′ ⊃ O: ∀ o ∈ O′: ∀ a ∈ A: moa = 1
∄ A′ ⊃ A: ∀ o ∈ O: ∀ a ∈ A′: moa = 1
In total, FCA identifies 32,805 blocks in the Red Hat dataset (for a subset see Figure 4). As an example for a block consider B2 = (O2, A2):
| O2 | = | {PyQt, ark, arts, avahi-qt3, cervisia, |
| chromium, ..., 155 packages in total} | ||
| A2= | {glibc, qt} |
| O3 | = | {PyQt, arts, doxygen-doxywizard, k3b, kdbg, |
| kdeaddons, ..., 34 packages in total} | ||
| A3= | {glibc, qt, xorg-x11-libs} |
Out of the 155 packages that depend on glibc and qt, only 34 also depend on xorg-x11-libs. Note that between B2 and B3 the set of dependencies grows (A2 ⊂ A3) and the set of packages shrinks (O2 ⊃ O3).
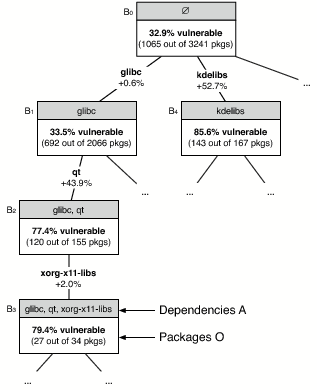
Figure 4: Part of the Red Hat concept lattice
FCA records specialization relationships between blocks such as between B2 and B3 in a concept lattice (Figure 4). We combine this lattice with a statistical analysis to identify dependencies that correlate with vulnerabilities. To assess the vulnerability risk of a block B = (O, A), we measure the percentage of packages in O that are vulnerable, i.e., have a non-zero entry in the vulnerability vector v. This percentage indicates the risk of being vulnerable when depending on the packages in the set A.
risk((B = (O, A)) = |{o : o ∈ O, vo > 0}| ⁄ |O|
In Figure 4, the risk of B2 is 120/155 = 77.4% and the risk of B3 is 27/34 = 79.4%. The top most block B0 in the lattice represents all Red Hat packages because when A = ∅, every package o satisfies the condition ∀ a ∈ A: moa = 1. Thus when nothing is known about their dependencies the risk of packages is 1065/3241 = 32.9%.
Both B2 and B3 have a substantially higher risk than B0, which means that depending on glibc, qt, and xorg-x11-libs increases the chances of a package being vulnerable. To find out which dependencies matter most, we traverse the concept lattice and test whether the changes in risk are statistically significant. We use χ2 tests if the entries in the corresponding contingency table are all at least 5, and Fischer Exact Value tests if at least one entry is 4 or less [34, 37].
For example between B0 and B1 there is no statistically significant change in risk; in other words, a dependency on glibc has little impact on packages being vulnerable. However, risk significantly increases between B1 and B2 by 43.9 percentage points, thus depending on qt when already depending on glibc correlates with the vulnerability of packages. Risk does not change significantly between B2 and B3, which indicates that xorg-x11-libs does not increase the risk any further.
Note that in the example, qt increases the risk only when there is a dependency on glibc. We call such a condition the context C. The context can be empty; for example in Figure 4, the block B4 shows that without any context, a dependency on kdelibs increases the risk of vulnerabilities by 52.9 percent points.
Table 1: The Beasts in Red Hat.
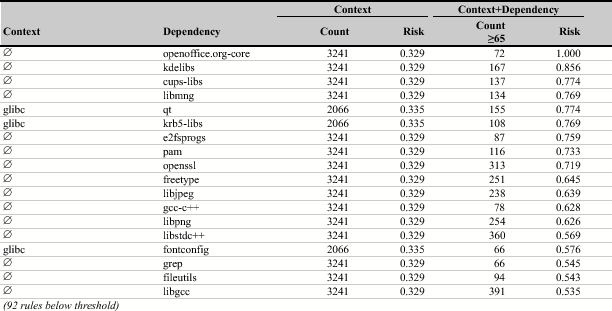
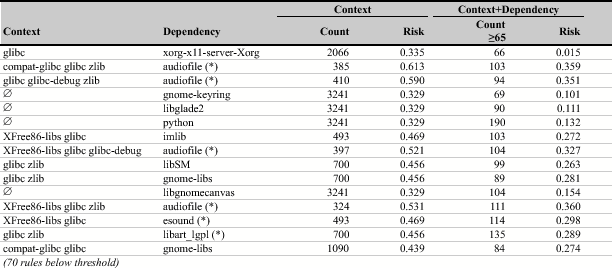
Table 2: The Beauties in Red Hat.
To find the patterns reported in this paper, we checked for each edge e = (Bi, Bj) in the concept lattice that
Several of the beasts in Table 1 are related to security and cryptography, for example, krb5-libs, pam and openssl. One possible reason could be that applications that depend on these packages have to protect sensitive data and thus are more likely to be the target of an attack. Many graphics libraries are beasts as well, for example, libmng, libjpeg, and libpng (related to image file formats) as well as freetype and fontconfig (related to fonts). Often such libraries are misused by developers and buffer overflows are introduced into an application.
The most notable beauty in Table 2 is python, which indicates that Python applications are less likely to be vulnerable. One may ask what about the perl package? Here we found two beast rules, which are listed below because they lacked support count to be included in Table 1.
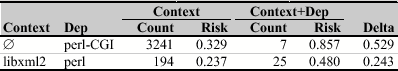
Applications that depend on perl-CGI or use perl in addition to libxml2 are more likely to be exposed to vulnerabilities. However, we advise caution when interpreting these results; Python applications are not guaranteed to be better or safer than Perl applications. Whether an application is vulnerable is not solely determined by dependencies. The experience of developers and the development process are other factors with a strong influence on vulnerabilities.
Another “religious” comparison is between the two rival desktop managers KDE and Gnome. Here, a dependency to kdelibs is listed as a beast, while dependencies to gnome-keyring and gnome-libs are listed as beauties. Again, we advise caution when interpreting these results.
Some dependencies are both beasts and beauties, but within different contexts. For example consider the following two rules for the package esound:
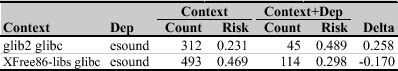
When applications depend on glib2 and glibc, an additional dependency to esound increases the risk of vulnerabilities. In contrast, when applications depend on XFree86-libs instead of glib2, the additional esound dependency decreases the risk. Overall, we found only four hybrid dependencies: audiofile, esound, glib, and libart_lgpl. In Table 2, we mark rules involving hybrid dependencies with an asterisk (*); there are no such rules in Table 1 because they are below the support count threshold of 65.
Overall, only a few beauties have an empty context, i.e., decrease the risk unconditionally, while most beasts always increase risk. To some extent this is intuitive since any extra dependency adds some potential risk to an application and only a few dependencies have enough positive influence to mitigate this risk. Also, it is important to point out that we reported statistical results. Just adding a dependency to python or gnome-keyring will not guarantee a safe application. In the end, it is always the developer who introduces a vulnerability, either by using a library incorrectly or by implementing unsafe code.
In the previous section we showed that there is an empirical correlation between certain package dependencies and vulnerabilities. In this section, we use this observation to predict which packages have vulnerabilities by using just the names of the dependencies.
We use Support Vector Machines (SVMs) for our prediction models. SVMs are a supervised learning technique that is used for classification and regression [36]. In the terminology of Section 2, we are given the dependency matrix M and the vulnerability vector v, and the SVM computes a model from them. This is known as training the model. Then, one can use this model on a new row vector mn + 1 to compute a prediction \hat{v}n+1. Hatted values such as \hat{v}k are always the result of a prediction; un-hatted values are known beforehand and are assumed to be exact. Our implementation used the SVM library for the R project [28, 8] with a linear kernel.
We chose SVMs in favor of other machine learning techniques because they have several advantages [5]: first, when used for classification, SVMs cope well with data that is not linearly separable;7 second, SVMs are less prone to overfitting.8
In order to assess the quality of a classification or regression model, we split the available packages randomly in two parts: a training set (two thirds) and a testing set (one third). A classification or regression model is then built from the training set and predictions are made for the packages in the testing set. These predictions \hat{v}k are then compared with the actual observed values vk and differences are penalized as described in the subsequent sections.
In order to compare the quality of the SVM predictions, we also used decision trees, specifically those resulting from the C4.5 algorithm [27] to train and test the same splits that were used for SVMs. Decision trees are readily interpreted by humans (all classifications can be explained by the path taken in the tree) and therefore have explanatory power that support vector machines lack. It is therefore interesting to compare these two approaches.
For classification, vk is either 0—no vulnerabilities—or 1—vulnerable. Therefore, the classification problem in our case is, “Given new dependency vectors, will their associated vulnerability values be 0 or not?” In other words, given new packages, we want to predict whether they have vulnerabilities or not. A typical use for such a prediction is to assess whether a new package needs additional testing or review before it is included in a distribution.
For classification, each prediction belongs to one of the following four categories:
| precision | = | TP / (TP + FP) |
| recall | = | TP / (TP + FN) |
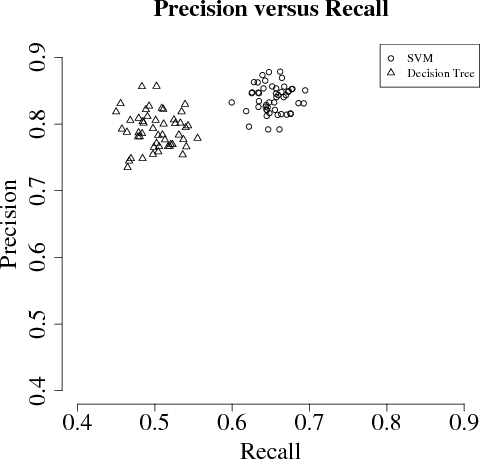
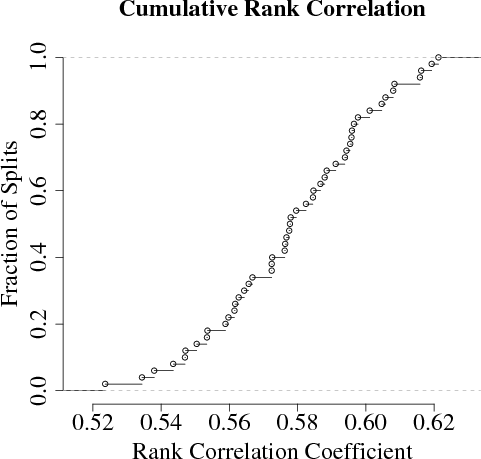
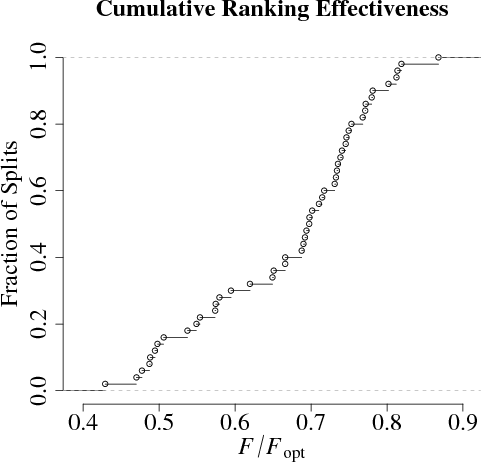
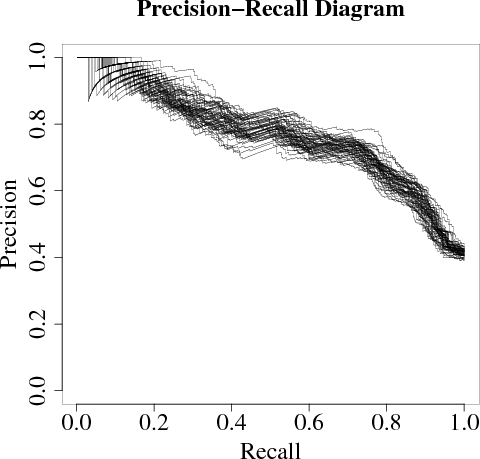
Figure 5: Prediction results for 50 random splits (both classification and ranking).
The regression problem in our case is, “Given new dependency vectors, what is their rank order in number of vulnerabilities?” In other words, given new packages, we want to know which of them have the most vulnerabilities. A typical use for such a prediction is to decide on the order in which packages are tested or reviewed.
For regression, we report the Spearman rank correlation coefficient ρ, which is a real number between -1 and 1. If ρ = 1, the predicted and actual values have the same ranks (identical rankings): when the predicted values go up, so do the actual values and vice versa. If ρ = -1, the predicted and actual values have opposite ranks (opposite ranking): when the predicted values go up, the actual values go down, and vice versa. If ρ = 0, there is no correlation between predicted and actual values.
Because the rank correlation coefficient is computed for all packages in a testing set, it is an inappropriate measure for how well a model prioritizes resources for quality assurance when only a subset of packages are investigated. Let us illustrate this with a simple example. Suppose that we can spend T units of time on testing and reviewing, and that testing or reviewing one package always takes one unit. In the best possible case, our prediction puts the actual top T most vulnerable packages in the top T slots of \hat{v}. However, the relative order of these packages does not matter because we will eventually investigate all top T packages. In other words, predicting the actual top T vulnerable packages in any order is acceptable, even though some correlation values ρ will be poor for some of those orderings.
To account for this scenario, we compute an additional measure, which we call ranking effectiveness. Let l be the number of new dependency vectors and let p = (p1, …, pl) be a permutation of 1, …, l such that the predictions \hat{v}p = (\hat{v}p1, …, \hat{v}pl) are sorted in descending order (i.e., \hat{v}pj ≥ \hat{v}pk for 1 ≤ j < k ≤l). Let q be another permutation that sorts the observed values vq in descending order. When we now investigate package pj, by definition we can find and fix vpk vulnerabilities. Therefore, when we investigate the top T predicted packages, we find
F = ∑1 ≤ j ≤ T vpj
vulnerabilities, but with optimal ordering, we could have found
Fopt = ∑1 ≤ j ≤ T vqj
vulnerabilities. Therefore, we will take the quotient
Q = F ⁄ Fopt = ∑1 ≤ j ≤ T vpj ⁄ ∑1 ≤ j ≤ T vqj
as another quality measure for ranking vulnerable packages.
For ranking, we also report a precision-recall graph. This graph visualizes the trade-off between precision and recall by plotting precision against recall when packages are examined in a given order. For effective rankings, the precision will start out near 1.0 and will gradually drop to the fraction of vulnerable packages. Precision-recall graphs indicate how robust prediction models are and can also help choosing a different operating point. For example, in cases where 65% recall is considered to low, a precision-recall diagram allows choosing a higher recall and shows the resulting precision.
The results of classifying and ranking 50 random splits are shown in Figure 5. The first subfigure is for classification, the others are for ranking.
The same figure also contains the respective values for the decision tree (shown as triangles). The median precision is 0.79 (standard deviation 0.0277), and the median recall is 0.50 (standard deviation 0.0264). The median values for both precision and recall are significantly greater for the SVM than for the decision tree models (p < 0.001).9 The decision tree not only performs worse than the SVM both for precision and recall, the results are also less consistent.
The last subfigure shows a precision-recall diagram for each of the random splits. These diagrams show the behavior for effective predictors: they start out at or very near to 1.0 and gradually drop to about 0.35, which is the fraction of vulnerable packages 1133/3241 = 0.35). The different precision-recall curves also stay close together, indicating consistence across random splits.
In the previous section we showed that the names of dependencies can actually predict vulnerabilities. In this section, we refine these results motivated by two observations:
As we have seen, SVMs outperform decision trees for our data set. However, unlike decision trees, SVMs do not explain predictions, which makes it hard for developers to comprehend and have confidence in the outcome of SVM predictions. Even when they know that our models are correct in eight out of ten cases, it remains difficult for them to recognize the two cases where the model errs. In order to better explain the decision of an SVM to developers, we describe how to find dependencies that were most influential for the SVM's decision. Dependencies that led the SVM to classify a package as vulnerable are candidates for removal, replacement, or increased quality assurance.
An SVM model is a hyperplane H in m dimensions, where m ≥ n holds to ensure that the data is linearly separable.10 When used to classify a dependency vector w, which has n dimensions, the vector is first transformed to a vector w′ in m dimensions, according to the kernel used. Then the model looks on which side of the hyperplane vector w′ lies and returns the respective classification. The dependency that was most influential for the classification of a package is that dependency which moved the package the furthest away from the hyperplane, measured by the distance of w′ to H. One can use this technique also to rank all dependencies of a package.
Assume first that the linear kernel is used for the SVM. This kernel does not introduce any additional dimensions (thus m = n) nor does it perform any transformations (w = w′). Since the dependency vector w is binary (i.e., wk is either 0 or 1), one way of computing the most influential dependency is first to drop a perpendicular vector p from w on H. Then s is the dimension of this perpendicular vector p for which |ps| is a maximum.
If a kernel other than the linear one is used (m > n), we can find the most influential dependency as follows. For every component (dependency) k of the vector w for which wj = 1, we create a new, artificial, “flipped” dependency vector f by setting this component to 0:
fk = 0 if k = j; wk otherwise.
Then the most influential dependency is the one for which the flipped and transformed dependency vector f′ minimizes the distance to the hyperplane H (or even changes the classification from vulnerable to non-vulnerable). We call this technique bit-flipping.
As an example, consider the sendmail package with 21 dependencies. The distance between its dependency vector and the separating hyperplane is 3.88. The maximum reduction in distance is 0.73 and occurs with the removal of cyrus-sasl from the dependencies of sendmail. The package cyrus-sasl implements the Simple Authentication and Security Layer (SASL) [21], which is used to add authentication to connection-based protocols such as IMAP. The package is one the most popular SASL implementations; however, the high reduction in distance to the separating hyperplane, suggests that replacing the dependency with another SASL implementation (such as GNU SASL [17]) could decrease the risk of vulnerabilities. In any case, one should track patches and vulnerabilities in the cyrus-sasl package to check whether they affect sendmail.
In order to predict fragile packages, i.e., regular packages that will turn into vulnerable packages, we again used SVMs. We took RHSAs prior to January 2008 to build a model from which we predicted which non-vulnerable packages have yet undiscovered vulnerabilities. We then used RHSAs from January 2008 onwards and additional information to assess the quality our model. The higher the percentage of correctly predicted packages, the stronger the model.
The basic idea is to learn an SVM regression model for the entire dataset (until January 2008) and then apply the model again to the same data. Packages without vulnerabilities but with predicted vulnerabilities are then considered to be fragile packages. Essentially, we predict the packages that the SVMs fails to describe in its model (and thus having high residuals) to be fragile.
More formally, using the notation of Section 2, we use an SVM to build a regression model from M. We then input the dependency vectors of M into the same SVM model to get n predictions (\hat{v}1, …, \hat{v}n). Next, we consider only the predictions \hat{v}j for packages with no known vulnerabilities, that is, for which vj = 0. Finally, we sort the \hat{v}j in descending order. We hypothesize that packages with high \hat{v}j are more likely to have vulnerabilities discovered in the future.
For the Red Hat data, we have 3241 packages, of which 2181 had no vulnerabilities reported by January 2008. Until August 2008, 73 packages turned vulnerable (or 3.3%). The result of our prediction is a list of 2181 packages, sorted in decreasing order by expected number of vulnerabilities. We want the newly-found vulnerable packages to appear early in this list. The top 25 predictions are shown in Table 3. Packages found to have vulnerabilities after January 2008 are marked with the symbol ✔. In this case, the last column contains a reference to the respective advisory.
Table 3: Predicted packages.
| Package | Reported Vulnerability | ||
| ✔ | #1 | mod_php | Integration into php [6] |
| #2 | php-dbg | ||
| #3 | php-dbg-server | ||
| #4 | perl-DBD-Pg | ||
| #5 | kudzu | ||
| #6 | irda-utils | ||
| #7 | hpoj | ||
| #8 | libbdevid-python | ||
| #9 | mrtg | ||
| ✔ | #10 | evolution28-evolution-data-server | RHSA-2008:0515-7(a) |
| #11 | lilo | ||
| ✔ | #12 | ckermit | Xatrix Advisory #2006-0029(b) |
| ✔ | #13 | dovecot | RHSA-2008:0297-6(c) |
| #14 | kde2-compat | ||
| #15 | gq | ||
| ✔ | #16 | vorbis-tools | Ubuntu Advisory USN-611-2(d) |
| #17 | k3b | ||
| #18 | taskjuggler | ||
| ✔ | #19 | ddd | Inspection (see Section 5.2) |
| #20 | tora | ||
| ✔ | #21 | libpurple | RHSA-2008:0297-6(e) |
| #22 | libwvstreams | ||
| ✔ | #23 | pidgin | RHSA-2008:0584-2(f) |
| #24 | linuxwacom | ||
| ✔ | #25 | policycoreutils-newrole | Changelog entry (Section 5.2) |
| (a) https://rhn.redhat.com/errata/RHSA-2008-0515.html | |||
| (b) https://www.xatrix.org/advisory.php?s=8162 | |||
| (c) https://rhn.redhat.com/errata/RHSA-2008-0297.html | |||
| (d) https://www.ubuntu.com/usn/usn-611-2 | |||
| (e) https://rhn.redhat.com/errata/RHSA-2008-0297.html | |||
| (f) https://rhn.redhat.com/errata/RHSA-2008-0584.html | |||
For Table 3, we used sources in addition to the official RHSAs.11 We marked package evolution28-evolution-data-server as vulnerable because the main package, evolution28, was affected by RHSA-2008:0515. In addition, we marked policycoreutils-newrole because the Changelog entry for version 1.30.28-1 reads, “Security fixes to run python in a more locked down manner”. This was apparently a pro-active fix, since there seems to have been no exploit.
In Table 3 the top 25 predictions contain 9 packages with newly-found vulnerabilities (36%). Taking into account the low percentage of packages that turned vulnerable (3.3%), our prediction is significantly better than random guesses (at p < 0.001). Note that the 36% is a lower bound for the precision because the non-vulnerable packages might yet have undiscovered vulnerabilities.
When we performed a cursory review of its source code, we almost immediately found a code-injection vulnerability. This vulnerability occurs in exectty.C, where a pipe is opened using popen(), but the arguments to the shell are not properly quoted, thus allowing for the insertion of extraneous shell commands for anyone with write access to a configuration file. This will make it possible to run arbitrary code for anyone with local access to the machine if the configuration file is not write protected. Such code injection and arbitrary code execution vulnerabilities are typically classified as “moderate” by Red Hat.
Another security code smell occurs in xconfig.C and concerns the use of fgets():
char buffer[PATH_MAX]; buffer[0] = '\0'; fgets(buffer, sizeof(buffer), fp); pclose(fp);The C standard guarantees that buffer is null-terminated when any characters are read at all, and unchanged when no characters are read. Therefore, in these two cases, buffer will always be properly null-terminated. However, if a read error occurs, the contents of buffer are “indeterminate” [16, Section 7.19.7.2]. This means that after a read error, it is no longer guaranteed that buffer is null-terminated, the strlen call could run away, and the subsequent access to buffer[len - 1] could cause a buffer overflow. The fix is simple: simply exit whenever fgets returns null. The impact of this flaw is not clear; however, there have been arbitrary code execution vulnerabilities resulting from similar errors; see for example CVE 2007-5135 [23].int len = strlen(buffer); if (len > 0 && buffer[len - 1] == '\n') buffer[len - 1] = '\0';
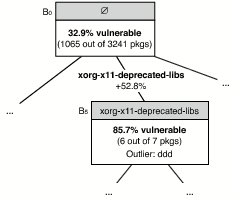
Figure 6: Example of an anomaly.
Another approach for predicting fragile packages is to search for anomalies in the concept lattice. The basic idea is that for blocks where all but a few packages are vulnerable, the non-vulnerable packages are likely to be fragile. As an example consider B5 = (O5, A5) from Figure 6:
| O5 | = | {ddd, .png, nedit, openmotif, openmotif-devel, |
| openmotif21, xorg-x11-deprecated-libs-devel} | A5 | = | {xorg-x11-deprecated-libs} |
From the 110 rules found in Section 3 for beasts, we selected all rules that had at most three outliers. For the 17 selected rules, we then combined all outliers to come up with a prediction of 27 unique fragile packages (including ddd). Out of these, 7 predictions were correct (precision of 25.9%). As in the previous section, the results are significantly better than random guesses (p < 0.001) and should be considered a lower bound for precision because of yet undiscovered vulnerabilities.
When we look at DDD's source code, we find this assessment confirmed: much of the graphics code in DDD is on the lowest level, using Xlib directly; other parts use Xt, one of the oldest graphics toolkits for X Windows. This suggests that DDD is old (it was first released in the 1990's) and has not been actively maintained in the last few years (the most recent release is from 2004). This alone makes it unlikely that it has fixes for all the pitfalls that have surfaced recently. Not surprisingly, the new DDD maintainer wants to switch over to a more modern toolkit such as Qt [9, Entry 2008-05-06], certainly to give DDD a more modern appearance, but also perhaps to offload the burden of maintaining and fixing low-level code to a more active project.
In this section, we discuss threats to validity of our study.
For our analysis, we ignore the possible evolution of dependencies. That is, we assume that the dependency matrix M (see Equation 1) does not change with time. We believe that it is reasonable to assume that M will not change much: a dependency of package j on package k exists because package j will want to use services offered by package k. Changing this dependency will mean that the package will have to supply these services itself, stop using them entirely, or use another package to supply them. Any of these alternatives is usually work-intensive, so there is a strong economic incentive against frequently changing dependencies.
One complicating factor when using precision and recall to evaluate our approach is that there may be undiscovered vulnerabilities leading to too low values for vk. For example, it is possible and even likely that for some packages vk is 0, even though package k does in fact have a vulnerability. In practice, this means that the computed value for the precision will be lower than the true precision value (because the true number of false positives may be lower than what was computed). We can therefore regard our precision values as a lower limit. We cannot make a similar estimation for the recall values, since both false-positive and false-negative values can change. Therefore, the recall values are merely approximations to their true values.
In determining the most influential dependency, we ignore the joint effect of two or more dependencies: it could be that two dependencies together are much more influential than a single dependency, and that two together are a better explanation of the classification of a package than the single dependency that results from the distance minimization technique. This should be the object of further study.
For this paper, we considered only how first-order12 (or direct) dependencies influence vulnerability. We also did not distinguish between different types and severities of vulnerabilities. In practice, however, many other factors such as developer experience, quality assurance, complexity of source code, and actual usage data likely influence the number of vulnerabilities as well, either separately or in combination. However, there is little scientific evidence for this wisdom and more empirical studies are needed to learn more about vulnerabilities. This paper is a first step in this direction.
We described the phenomenon that some dependencies increase vulnerability, and some decrease vulnerability. We also demonstrated that dependencies have predictive ability. Why is this the case?
Our first hypothesis is that dependencies describe the problem domain of packages and that some domains are simply more risky than others. For example, we would expect web applications to have more vulnerabilities than C compilers because they have a much larger attack surface. Schröter et al. found similar evidence for the increased error-proneness of some domains [31].
Our second hypothesis is that certain usages may make a package more vulnerable. For example, some packages use unsafe services, i.e., services that are inherently unsafe. Similar, there can be also unsafe use of services, i.e., some services are difficult to use safely. Both these situations reflect in the dependencies of a package. In an earlier study, Neuhaus found evidence for unsafe usages on the source-file level of Firefox [24].
We will investigate both hypotheses in future work.
Only few empirical studies exist for software vulnerabilities. Shin and Williams [32] correlated several complexity measures with the number of security problems, for the JavaScript Engine of Mozilla, but found only a weak correlation. This indicates that there are further factors that influence vulnerabilities, like dependencies as we have showed in this paper.
Gegick et al. used code-level metrics such as lines of code, code churn, and number of static tool alerts [12] as well as past non-security faults [11] to predict security faults. In the most recent work, Gegick et al. achieved a precision of 0.52 and a recall of 0.57. In comparison, the precision and recall values are higher in our experiments (0.83 and 0.65 respectively). However, these numbers are not directly comparable because different data sets were used for the experiments
Based on a pilot study by Schröter et al. [31], Neuhaus et al. [25] investigated the Mozilla project for the correlation of vulnerabilities and imports, that is, the include directives for the functions called in a C/C++ source file. They found a correlation and were subsequently able to predict with SVMs vulnerabilities that were unknown at the time of the prediction.
Compared to the earlier work by Neuhaus et al. [25], we introduce in this paper an approach to assess the risk of dependencies (concept analysis + statistical testing), compare multiple prediction models (not just SVMs, but also decision trees and anomalies), and show how to explain SVM predictions. Also the focus of this paper is entirely different. Instead of a single program, we analyze vulnerabilities for a large software distribution, Red Hat Linux, that consists of several thousand packages. Thus our base of evaluation is much broader: a software distribution covers a wider range of application scenarios, programming languages, and probably every other distinguishing variation, as opposed to a single program. In addition, a software distribution will typically cover a greater range of software quality than a single software project, where the number of contributors is much smaller. The extent of these difference is probably best emphasized by the list of beauties and beasts that we presented in Section 3. This list can serve as a catalog for developers to assess the risk of dependencies and help them make well-informed design decisions.
The idea of finding anomalies using concept analysis (used in Section 5.3) was proposed by Lindig [19]. For the experiments in this paper, we extended Lindig's approach with statistical hypothesis testing. That is, we considered only anomalies for rules which significantly increased the risk of vulnerabilities. In our experiments, this enhancement substantially reduced the number of false positives.
Robles et al. [30] and German [13] studied software distributions to better understand open-source software development. Both studies, however, ignored the relation between package dependencies and vulnerabilities.
Ozment at al. [26] and Li et al. [18] have studied how the number of defects and security issues evolve over time. The two studies report conflicting trends. Additionally, neither of the two approaches allow mapping of vulnerabilities to packages or predictions. Di Penta et al. [7] tracked vulnerabilities across versions in order to investigate how different kinds of vulnerabilities evolve and decay over time.
Alhazmi et al. use the rate at which vulnerabilities are discovered to build models to predict the number of future vulnerabilities [2]. In contrast to our approach, their predictions depend on a model of how vulnerabilities are discovered. Tofts et al. build simple dynamic models of security flaws by regarding security as a stochastic process [35], but they do not make specific predictions about vulnerable packages. Yin et al. [38] highlight the need for a framework for estimating the security risks in large software systems, but give neither an implementation nor an evaluation.
In this paper, we presented a study of vulnerabilities in 3241 software packages of the Red Hat Linux distribution. We provided empirical evidence for a correlation between vulnerabilities and certain dependencies. Furthermore, we showed that prediction models using package dependencies perform well when predicting vulnerabilities. Another observation is that the popular wisdom that vulnerable packages will tend to develop even more vulnerabilities does not hold for the packages within Red Hat: the number of vulnerable packages needing two fixes or fewer (584) is greater than the number of packages needing more than two fixes (549). If the popular wisdom were correct, one would see a majority of packages with a high number of fixes.
Our future work will include the following:
Often empirical findings are highly project-specific and rarely apply to other projects. This dilemma is illustrated best by a study of Nagappan et al. [22] who compared five large subsystems of Microsoft Windows and found that for each subsystem, there were metrics that worked reasonably well, but that no single metric worked well for every subsystem to predict failures. Since any empirical study depends on a large number of context variables [4], replication has become an important practice to generalize results.
We believe that the work presented in this paper is a first step towards a new generation of empirical studies. Rather than just a few projects, we analyzed vulnerabilities for several thousand Red Hat packages. Our findings come therefore with a higher generality compared to traditional single-project studies. While it may be that our work does not generalize to other package collections, we consider this highly unlikely, at least for Linux: other package collections will contain much the same packages, with much the same dependencies.
Another characteristic of our study is that software developers can directly benefit by the results. By consulting the catalog of beauties and beasts, developers can quickly assess the risk of dependencies to other packages and thus make informed decisions. This lookup is possible with little data (only the dependencies are needed) and without adjusting any prediction models.
To conclude, we are confident that the availability of cross-project repositories (such as the Red Hat Security Advisory database) will lead to more large-scale studies such as the one presented in this paper.
Stephan Neuhaus was supported by funds from the European Commission (contract N° 216917 for the FP7-ICT-2007-1 project MASTER). This work was conducted while Tom Zimmermann was with the Department of Computer Science at the University of Calgary, Canada. Tom Zimmermann was supported by a start-up grant from the University of Calgary.
1 Software packages are sets of related files, e.g., libraries or applications, distributed in a special file format (RPM) that allows for their automated management, for example through installation and deinstallation.
2 For the study in this paper, we consider only packages that are available from Red Hat itself because they are the ones supported by Red Hat with security advisories. The total number of RPMs available for Red Hat includes third-party RPMs and is thus certainly much larger than 3241.
3 Strictly speaking, the security issues addressed in RHSAs need not be vulnerabilities—a vulnerability is considered to be a “flaw in software that can be exploited” [33, p. 52]. From looking at a sample of RHSAs, we conclude however that this is almost always the case and thus RHSAs are a good approximation for true vulnerabilities. Josh Bressers of the Red Hat Security Response Team also confirmed that flaws that do not cross a trust boundary are classified as bugs and not as security advisories [6].
4 The first RHSA we consider is RHSA-2000:001 and the last is RHSA-2008:0812. When the first advisory was issued in 2006, Red Hat switched to four-digit serial numbers. The serial number at the end is also incremented for bug fix advisories (RHBA) and enhancement advisories (RHEA). Every year the serial number is reset to 0001.
5 Although version information is also present for each dependency (in the tag RPMTAG REQUIREVERSION), we assumed dependencies to be constant in our experiments. We discuss this decision as a potential threat to validity in Section 5.4.
6 Formal concept analysis (FCA) is similar to market basket analysis or frequent pattern mining [1, 20], which made the famous discovery that diapers and beer are often purchased together. In data mining, the set A is called a pattern (for example, diapers and beer) and the set O are the supporting transactions, with |O| being the support count. If |O| exceeds a given threshold, the pattern A is called frequent. FCA additionally provides a lattice with the relations between patterns, which we use to identify dependencies that significantly increase the risk of vulnerabilities.
7 Two sets of n-dimensional points are said to be linearly separable if there exists an (n - 1)-dimensional hyperplane that separates the two sets.
8 Overfitting often happens when a statistical model has too many parameters. The model will try to minimize the error for the training set, but the parameters will offer too many, wildly differing combinations that will make the error small. Choosing one such combination will then generally increase the error for the testing set. The only possible remedy for traditional models is to decrease the number of parameters. SVMs are less prone to overfitting because they choose a specific hyperplane (maximum margin hyperplane) among the many that separate the data [36].
9 The p-value has been corrected for multiple hypothesis testing using the Bonferroni method.
10 Recall that n is the dimensionality of the input space, in our case the number of dependencies.
11 In using additional sources, we are not suggesting that Red Hat is negligent in assigning RHSAs. It may well be that the additional advisories found by us are not applicable to Red Hat distributions. Still, security advisories, even when they are not directly applicable to Red Hat packages, indicate that investigating those packages would have been worthwhile.
12 If package p depends on package q, we call q a first-order dependency. If p depends only indirectly on q, we call q a higher-order dependency.
[1] Rakesh Agrawal and Ramakrishnan Srikant. Fast algorithms for mining association rules in large databases. In VLDB'94: Proc. of 20th Int'l. Conf. on Very Large Data Bases, pages 487–499. Morgan Kaufmann, 1994.
[2] Omar Alhazmi, Yashwant Malaiya, and Indrajit Ray. Security Vulnerabilities in Software Systems: A Quantitative Perspective, volume 3645/2005 of Lecture Notes in Computer Science, pages 281–294. Springer Verlag, Berlin, Heidelberg, August 2005.
[3] Edward C. Bailey. Maximum RPM: Taking the red hat package manager to the limit. https://www.rpm.org/max-rpm/, 2000. Last accessed on August 22, 2008.
[4] Victor R. Basili, Forrest Shull, and Filippo Lanubile. Building knowledge through families of experiments. IEEE Trans. Software Eng., 25(4):456–473, 1999.
[5] Ladislav Bodnar. Is RPM doomed? https://distrowatch.com/dwres.php?resource=article-rpm, 2002. Last accessed: Aug. 2008.
[6] Josh Bressers. Personal communication, March 2008.
[7] Massimiliano Di Penta, Luigi Cerulo, and Lerina Aversano. The evolution and decay of statically detected source code vulnerabilities. In Proc. Int'l. Working Conf. on Source Code Analysis and Manipulation (SCAM), 2008.
[8] Evgenia Dimitriadou, Kurt Hornik, Friedrich Leisch, David Meyer, and Andreas Weingessel. r-cran-e1071. https://mloss.org/software/view/94/, 2008.
[9] Free Software Foundation. DDD data display debugger. https://www.gnu.org/software/ddd/, August 2008.
[10] Bernhard Ganter and Rudolf Wille. Formal Concept Analysis: Mathematical Foundations. Springer, Berlin, 1999.
[11] Michael Gegick, Pete Rotella, and Laurie William. Toward non-security failures as a predictor of security faults and failures. In Proc. Int'l. Symposium on Engineering Secure Software and Systems (ESSoS), 2009. To appear.
[12] Michael Gegick, Laurie Williams, Jason Osborne, and Mladen Vouk. Prioritizing software security fortification throughcode-level metrics. In QoP '08: Proc. of the 4th ACM workshop on Quality of protection, pages 31–38. ACM, 2008.
[13] Daniel M. Germán. Using software distributions to understand the relationship among free and open source software projects. In Proc. Int'l. Workshop on Mining Software Repositories (MSR), page 24, 2007.
[14] Lawrence A. Gordon, Martin P. Loeb, William Lucyshyn, and Robert Richardson. CSI/FBI computer crime and security survey. Technical report, Computer Security Institute (CSI), 2005.
[15] Jiawei Han and Micheline Kamber. Data Mining: Concepts and Techniques. Morgan Kaufmann, 2nd edition, 2005.
[16] Int'l. Organization for Standardization and Int'l. Electrotechnical Commission. ISO/IEC 9899:TC3 committee draft. Technical report, Int'l. Organization for Standardization, September 2007.
[17] Simon Josefsson. GNU SASL library—libgsasl. https://josefsson.org/gsasl, August 2008.
[18] Zhenmin Li, Lin Tan, Xuanhui Wang, Shan Lu, Yuanyuan Zhou, and Chengxiang Zhai. Have things changed now? an empirical study of bug characteristics in modern open source software. In Proc. Workshop on Architectural and System Support for Improving Software Dependability 2006, pages 25–33, October 2006.
[19] Christian Lindig. Mining patterns and violations using concept analysis. https://www.st.cs.uni-sb.de/~lindig/papers/lindig-2007-mining.png, 2007.
[20] Heikki Mannila, Hannu Toivonen, and A. Inkeri Verkamo. Efficient algorithms for discovering association rules. In KDD'94: AAAI Workshop on Knowledge Discovery in Databases, pages 181–192, 1994.
[21] John G. Myers. RFC 2222: Simple authentication and security layer (sasl). https://www.ietf.org/rfc/ rfc2222.txt, October 1997.
[22] Nachiappan Nagappan, Thomas Ball, and Andreas Zeller. Mining metrics to predict component failures. In Proc. 27th Int'l. Conf. on Software Engineering, New York, NY, USA, May 2005. ACM Press.
[23] National Institute of Standards. CVE 2007-5135. https://nvd.nist.gov/nvd.cfm?cvename=CVE-2007-5135, September 2007.
[24] Stephan Neuhaus. Repeating the Past: Experimental and Empirical Methods in Software Security. PhD thesis, Universität des Saarlandes, Saarbrücken, February 2008.
[25] Stephan Neuhaus, Thomas Zimmermann, Christian Holler, and Andreas Zeller. Predicting vulnerable software components. In Proc. 14th ACM Conf. on Computer and Communications Security (CCS), pages 529–540, October 2007.
[26] Andy Ozment and Stuart E. Schechter. Milk or wine: Does software security improve with age? In Proc. 15th Usenix Security Symposium, August 2006.
[27] Ross Quinlan. C4.5: Programs for Machine Learning. Morgan Kaufman Publishers, San Francisco, CA, USA, 1993.
[28] R Development Core Team. R: A Language and Environment for Statistical Computing. R Foundation for Statistical Computing, Vienna, Austria, 2008. ISBN 3-900051-07-0.
[29] RedHat Network. Errata. https://rhn.redhat.com/ errata/, August 2008.
[30] Gregorio Robles, Jesús M. González-Barahona, Martin Michlmayr, and Juan Jose Amor. Mining large software compilations over time: another perspective of software evolution. In Proc. Workshop on Mining Software Repositories, pages 3–9, 2006.
[31] Adrian Schröter, Thomas Zimmermann, and Andreas Zeller. Predicting component failures at design time. In Proc. 5th Int'l. Symposium on Empirical Software Engineering, pages 18–27, New York, NY, USA, September 2006.
[32] Yonghee Shin and Laurie Williams. Is complexity really the enemy of software security? In QoP '08: Proc. 4th ACM workshop on Quality of protection, pages 31–38. ACM, 2008.
[33] Adam Shostack and Andrew Stewart. The New School of Information Security. Pearson Education, Inc., Boston, MA, USA, 2008.
[34] Sidney Siegel and N. John Castellan, Jr. Nonparametric Statistics for the Behavioral Sciences. McGraw-Hill, 2nd edition, 1988.
[35] Chris Tofts and Brian Monahan. Towards an analytic model of security flaws. Technical Report 2004-224, HP Trusted Systems Laboratory, Bristol, UK, December 2004.
[36] Vladimir Naumovich Vapnik. The Nature of Statistical Learning Theory. Springer Verlag, Berlin, 1995.
[37] Larry Wasserman. All of Statistics: A Concise Course in Statistical Inference. Springer, 2nd edition, 2004.
[38] Jian Yin, Chunqiang Tang, Xiaolan Zhang, and Michael McIntosh. On estimating the security risks of composite software services. In Proc. PASSWORD Workshop, June 2006.