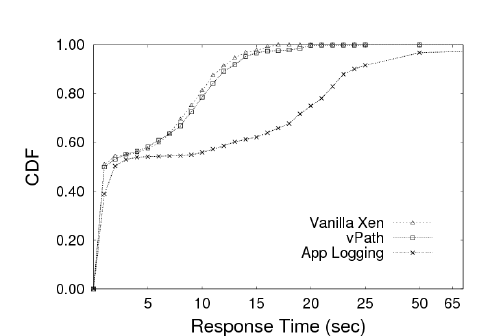
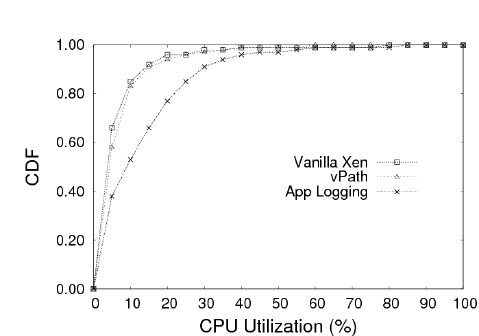
Check out the new USENIX Web site.


vPath: Precise Discovery of Request Processing Paths from Black-Box Observations of Thread and Network Activities

Byung Chul Tak*,   Chunqiang Tang+,   Chun Zhang+,
Sriram Govindan*,   Bhuvan Urgaonkar*,   and Rong N. Chang+
 
  *Dept. of Computer Science and Engineering, Pennsylvania State University
  +IBM T.J. Watson Research Center

Abstract

     Discovering end-to-end request-processing paths is crucial in many modern IT environments for reasons varying from debugging and bottleneck analysis to billing and auditing. Existing solutions for this problem fall into two broad categories: statistical inference and intrusive instrumentation. The statistical approaches infer request-processing paths in a "most likely" way and their accuracy degrades as the workload increases. The instrumentation approaches can be accurate, but they are system dependent as they require knowledge (and often source code) of the application as well as time and effort from skilled programmers.
     We have developed a discovery technique called vPath that overcomes these shortcomings. Unlike techniques using statistical inference, vPath provides precise path discovery, by monitoring thread and network activities and reasoning about their causality. Unlike techniques using intrusive instrumentation, vPath is implemented in a virtual machine monitor, making it agnostic of the overlying middleware or application. Our evaluation using a diverse set of applications (TPC-W, RUBiS, MediaWiki, and the home-grown vApp) written in different programming languages (C, Java, and PHP) demonstrates the generality and accuracy of vPath as well as its low overhead. For example, turning on vPath affects the throughput and response time of TPC-W by only 6%.

1  Introduction

     The increasing complexity of IT systems is well documented  [3,8,28]. As a legacy system evolves over time, existing software may be upgraded, new applications and hardware may be added, and server allocations may be changed. A complex IT system typically includes hardware and software from multiple vendors. Administrators often struggle with the complexity of and pace of changes to their systems.
     This problem is further exacerbated by the much-touted IT system "agility," including dynamic application placement [29], live migration of virtual machines [10], and flexible software composition through Service-Oriented Architecture (SOA) [11]. Agility promotes the value of IT, but makes it even harder to know exactly how a user request travels through distributed IT components. For instance, was server X in a cluster actually involved in processing a given request? Was a failure caused by component Y or Z? How many database queries were used to form a response? How much time was spent on each involved component? Lack of visibility into the system can be a major obstacle for accurate problem determination, capacity planning, billing, and auditing.
     We use the term, request-processing path, to represent all activities starting from when a user request is received at the front tier, until the final response is sent back to the user. A request-processing path may comprise multiple messages exchanged between distributed software components, e.g., Web server, LDAP server, J2EE server, and database. Understanding the request-processing path and the performance characteristics of each step along the path has been identified as a crucial problem. Existing solutions for this problem fall into two broad categories: intrusive instrumentation [4,20,9,8,30] and statistical inference [1,21,3,32,25].
     The instrumentation-based approaches are precise but not general. They modify middleware or applications to record events (e.g., request messages and their end-to-end identifiers) that can be used to reconstruct request-processing paths. Their applicability is limited, because it requires knowledge (and often source code) of the specific middleware or applications in order to do instrumentation. This is especially challenging for complex IT systems that comprise middleware and applications from multiple vendors.
     Statistical approaches are general but not precise. They take readily available information (e.g., timestamps of network packets) as inputs, and infer request-processing paths in a "most likely" way. Their accuracy degrades as the workload increases, because of the difficulty in differentiating activities of concurrent requests. For example, suppose a small fraction of requests have strikingly long response time. It would be helpful to know exactly how a slow request and a normal request differ in their processing paths-which servers they visited and where the time was spent. However, the statistical approaches cannot provide precise answers for individual requests.
     The IBM authors on this paper build tools for and directly participate in consulting services [13] that help customers (e.g., commercial banks) diagnose problems with their IT systems. In the past, we have implemented tools based on both statistical inference [32] and application/middleware instrumentation. Motivated by the challenges we encountered in the field, we set out to explore whether it is possible to design a request-processing path discovery method that is both precise and general. It turns out that this is actually doable for most of the commonly used middleware and applications.
     Our key observation is that most distributed systems follow two fundamental programming patterns: (1) communication pattern-synchronous request-reply communication (i.e., synchronous RPC) over TCP connections, and (2) thread pattern-assigning a thread to do most of the processing for an incoming request. These patterns allow us to precisely reason about event causality and reconstruct request-processing paths without system-dependent instrumentation. Specifically, the thread pattern allows us to infer causality within a software component, i.e., processing an incoming message X triggers sending an outgoing message Y. The communication pattern allows us to infer causality between two components, i.e., application-level message Y sent by one component corresponds to message Y' received by another component. Together, knowledge of these two types of causality helps us to precisely reconstruct end-to-end request-processing paths.
     Following these observations, our technique reconstructs request-processing paths from minimal information recorded at runtime-which thread performs a send or recv system call over which TCP connection. It neither records message contents nor tracks end-to-end message identifiers. Our method can be implemented efficiently in either the OS kernel or a virtual machine monitor (VMM). Finally, it is completely agnostic to user-space code, thereby enabling accurate discovery of request-processing paths for most of the commonly used middleware and applications.
     In general, a VMM-based implementation of our method is more challenging than an OS-based implementation, because it is more difficult to obtain thread and TCP information in a VMM. This paper presents a VMM-based implementation, because we consider it easier to deploy such a solution in cloud-computing environments such as Amazon's EC2 [2]. Our implementation is based on Xen [5]. In addition to modifying the VMM code, our current prototype still makes minor changes to the guest OS. We will convert it to a pure VMM-based implementation after the ongoing fast prototyping phase.

1.1  Research Contributions

We propose a novel set of techniques called vPath, for discovering end-to-end request-processing paths, which addresses most of the shortcomings of existing approaches. Specifically, we make the following contributions:
     The rest of this paper is organized as follows. Section 2 presents an overview of vPath. Section 3 describes vPath's implementation in detail. In Section 4, we empirically evaluate various aspects of vPath. We discuss related work in Section 5, and present concluding remarks in Section 6.

2  Overview of vPath

     In this section, we present an overview of vPath and discuss its applicability to existing software architectures.

2.1  Goodness Criteria

Several criteria are meaningful in assessing the desirability and efficacy of any request path discovery technique. Our design of vPath takes the following five into consideration. The first three are quantifiable metrics, while the last two are subjective.

2.2  Assumptions Made by vPath

     vPath makes certain assumptions about a distributed system's programming pattern. We will show that these assumptions hold for many commonly used middleware and applications. vPath assumes that (1) distributed components communicate through synchronous request-reply messages (i.e., synchronous RPC), and (2) inside one component, causality of events is observable through thread activities.
     Consider the example in Figure 1, where request-X received by component-I triggers request-Y being sent to component-II. vPath assumes that send-request-Y and send-reply-X are performed by the same thread. On the other hand, vPath allows that another thread (e.g., a front-end dispatcher thread) performs the recv-request-X operation and then one or more threads perform some pre-processing on the request before the request is handed to the last thread in this processing chain for final handling. vPath only requires that this last thread performs both send operations (send-request-Y and send-reply-X).
     Our discussion above focused on only one request. vPath supports multiple threads in one component concurrently processing different requests. These threads can execute in any order dictated by the CPU scheduler and synchronization libraries, producing interleaved sequences of request messages and reply messages.
Figure 1: An example of a request-processing path. The rectangles (components I and II) represent distributed software components. The ellipses represent events observed at individual components, e.g., recv-request-X is the event that message X-request is received by a thread in component-I. Message reply-X is the response to message request-X. Request-X and reply-X are sent over TCP1. Request-Y and reply-Y are sent over TCP2. The arrows show the request-processing path. The dotted line shows the conceptual linkage between send-request-Y and send-reply-X, which is the assumption of vPath, i.e., the same thread performs the two send operations.

2.3  Discovering Request-Processing Paths with vPath

     To reconstruct request-processing paths, vPath needs to infer two types of causality. Intra-node causality captures the behavior that, within one component, processing an incoming message X triggers sending an outgoing message Y. Inter-node causality captures the behavior that, an application-level message Y sent by one component corresponds to message Y' received by another component. Our thread-pattern assumption enables the inference of intra-node causality, while the communication-pattern assumption enables the inference of inter-node causality.
     Specifically, vPath reconstructs the request-processing path in Figure 1 as follows. Inside component-I, the synchronous-communication assumption allows us to match the first incoming message over TCP1 with the first outgoing message over TCP1, match the second incoming message with the second outgoing message, and so forth. (Note that one application-level message may be transmitted as multiple network-level packets.) Therefore, recv-request-X can be correctly matched with send-reply-X. Similarly, we can match component-I's send-request-Y with recv-reply-Y, and also match component-II's recv-request-Y with send-reply-Y.
     Between two components, we can match component-I's first outgoing message over TCP2 with component-II's first incoming message over TCP2, and so forth, hence, correctly matching component-I's send-request-Y with component-II's recv-request-Y.
     The only missing link is that, in component-I, recv-request-X triggers send-request-Y. From the thread-pattern assumption, we can indirectly infer this causality with the help of the dotted line in Figure 1. Recall that we have already matched recv-request-X with send-reply-X. Between the time of these two operations, we observe that the same thread performs send-request-Y and send-reply-X. It follows from our thread-pattern assumption that recv-request-X triggers send-request-Y. This completes the construction of the end-to-end execution path in Figure 1.
     As described above, the amount of information needed by vPath to discover request-processing paths is very small. vPath only needs to monitor which thread performs a send or receive system call over which TCP connection. This information can be obtained efficiently in the OS kernel or VMM, without modifying any user-space code. Unlike existing methods [19,30,9], vPath needs neither message contents nor end-to-end message identifiers.

2.4  Applicability of vPath to Existing Threading Models

     In this section, we summarize three well-known threading models, and discuss vPath's applicability and limitations with respect to these models. For a more detailed study and comparison of these models, we encourage readers to refer to [7,18,34].

2.4.1  Dispatcher-worker Threading Model

Figure 2: Dispatcher-worker threading model.
     Figure 2 shows a component of an application built using the dispatcher-worker model, which is arguably the most widely used threading model for server applications. In the front-end, one or more dispatcher threads use the select() system call or the accept() system call to detect new incoming TCP connections or new requests over existing TCP connections. Once a request is identified, it is handed over to a worker thread for further processing. This single worker thread is responsible for executing all activities triggered by the request (e.g., reading HTML files from a disk or making JDBC calls to a database), and finally sending a reply message back to the user. After the worker thread finishes processing the request, it goes back into the worker thread pool, waiting to be picked to process another incoming request.
     This threading model conforms to vPath's thread-pattern assumption described in Section 2.2. Since a single worker thread executes all activities triggered by a request, the worker thread performs both send-request-Y and send-reply-X in Figure 1.

2.4.2  Event-Driven Model

Figure 3: Event-driven model.

     Figure 3 shows the architecture of an application's component built using the event-driven programming model. Compared with other threading models, the event-driven model uses a relatively small number of threads, typically equal to or slightly larger than the number of CPUs. When processing a request R, a thread T1 always uses non-blocking system calls. If it cannot make progress on processing the request R because a non-blocking I/O operation on behalf of R has not yet completed, the thread T1 records the current status of R in a finite state machine maintained for R, and moves on to process another request. When the I/O operation on behalf of R finishes, an event is created in the event queue, and eventually a thread T2 retrieves the event and continues to process R. Note that T1 and T2 may be different threads, both participating in processing the same request at different times. The event-driven model does not conform to vPath's thread-pattern assumption, and cannot be handled by vPath.

2.4.3  Staged Event-Driven Architecture (SEDA)

fig/seda_model.png
Figure 4: Staged Event-Driven Architecture.

     Figure 4 shows the architecture of a SEDA-based application component [34]. SEDA partitions the request processing pipeline into stages and each stage has its own thread pool. Any two neighboring stages are connected by an event queue. SEDA partially conforms to vPath's assumptions. If only the last stage sends outgoing messages, and if communication between distributed components is synchronous (as described in Section 2.2), then vPath will be able to correctly discover request-processing paths. Otherwise, vPath would fail.

2.5  Why vPath is Still Useful

     Among the three well-known threading models, vPath can handle the dispatcher-worker thread model, only partially handles the SEDA model, and cannot handle the event-driven model. However, we still consider vPath as a widely applicable and general solution, because the dispatcher-worker thread model is the dominant architecture among mainstream software. The wide adoption of the dispatcher-worker thread model is not accidental. Consider, for example, common middleware platforms such as J2EE, where threads are managed by the middleware and used to execute user code written by different programmers. Because the middleware cannot make strong assumptions about the user code's behavior (e.g., blocking or not), it is simplest and safest to adopt the dispatcher-worker thread model.
     The SEDA model has been widely discussed within the research community, but no consensus about its suitability has been reached (see Welsh's discussion in [33]). Moreover, wide adoption of the SEDA model in mainstream software is yet to be reported.
     The pure event-driven model in Figure 3 is rarely used in real applications. The Flash Web server [18] is often considered as a notable example that adopts the event-driven model, but Flash actually uses a hybrid between event-driven and multi-threaded programming models. In Flash, a single main thread does all non-blocking network I/O operations and a set of worker threads do blocking disk I/O operations. The event-driven model is not yet popular in real applications and there is considerable consensus in the research community that it is difficult to program and debug applications based on a pure event-driven model. Similar sentiments were expressed by Behren et al. [6], who have had extensive experience programming a variety of applications using the event-driven approach.
     Furthermore, even the frequently-cited performance advantages of the event-driven model are questionable in practice, as it is extremely hard to ensure that a thread actually never blocks. For example, the designers of Flash themselves observed that the supposedly never-blocking main thread actually blocks unexpectedly in the "find file" stage of HTTP request processing, and subsequently published multiple research papers [22,23] describing how they solved the problem by hacking the operating system. Considering the excellent expertise of the Flash researchers on this subject and the relatively small code size of Flash, it is hard to imagine that ordinary programmers working on complex commercial software would have a better chance of getting the implementation right.
     Because vPath's assumptions hold for most of the existing mainstream software, we consider vPath as a widely applicable and general solution. In Section 4, we will validate this using a wide range of applications, written in different programming languages, developed by a variety of communities.

3  Implementation of vPath

     The vPath toolset consists of an online monitor and an offline log analyzer. The online monitor continuously logs which thread performs a send or recv system call over which TCP connection. The offline log analyzer parses logs generated by the online monitor to discover request-processing paths and the performance characteristics at each step along these paths.
     The online monitor tracks network-related thread activities. This information helps infer the intra-node causality of the form "processing an incoming message X triggers sending an outgoing message Y." It also tracks the identity of each TCP connection, i.e., the four-element tuple (source_IP, source_port, dest_IP, dest_port) that uniquely identifies a live TCP connection at any moment in time. This information helps infer inter-node causality, i.e., message Y sent by a component corresponds to message Y' received by another component.
     The online monitor is implemented in Xen 3.1.0 [5] running on x86 32-bit architecture. The guest OS is Linux 2.6.18. Xen's para-virtualization technique modifies the guest OS so that privileged instructions are handled properly by the VMM. Xen uses hypercall to hand control from guest OS to the VMM when needed. Hypercalls are inserted at various places within the modified guest OS. In Xen's terminology, a VM is called a domain. Xen runs a special domain called Domain0, which executes management tasks and performs I/O operations on behalf of other domains.
     Below we first describe how vPath's online monitor tracks thread activities and TCP connections, and then describe the offline log analyzer.

3.1  Monitoring Thread Activities

     vPath needs to track which thread performs a send or recv system call over which TCP connection. If thread scheduling activities are visible to the VMM, it would be easy to identify the running threads. However, unlike process switching, thread context switching is transparent to the VMM. For a process switch, the guest OS has to update the CR3 register to reload the page table base address. This is a privileged operation and generates a trap that can be captured by the VMM. By contrast, a thread context switch is not a privileged operation and does not result in a trap. As a result, it is invisible to the VMM.
     Luckily, this is not a problem for vPath, because vPath's task is actually simpler. We only need information about currently active thread when a network send or receive operation occurs (as opposed to fully discovering thread-schedule orders). Each thread has a dedicated stack within its process's address space. It is unique to the thread throughout its lifetime. This suggests that the VMM could use the stack address in a system call to identify the calling thread. The x86 architecture uses the EBP register for the stack frame base address. Depending on the function call depth, the content of the EBP may vary on each system call, pointing to an address in the thread's stack. Because the stack has a limited size, only the lower bits of the EBP register vary. Therefore, we can get a stable thread identifier by masking out the lower bits of the EBP register.
     Specifically, vPath tracks network-related thread activities as follows:
     By default, system calls in Xen 3.1.0 are not intercepted by the VMM. Xen maintains an IDT (Interrupt Descriptor Table) for each guest OS and the 0x80th entry corresponds to the system call handler. When a guest OS boots, the 0x80th entry is filled with the address of the guest OS's system call handler through the set_trap_table hypercall. In order to intercept system calls, we prepare our custom system call handler, register it into IDT, and disable direct registration of the guest OS system call handler. On a system call, vPath checks the type of the system call, and logs the event only if it is a network send or receive operation.
     Contrary to the common perception that system call interception is expensive, it actually has negligible impact on performance. This is because system calls already cause a user-to-kernel mode switch. vPath code is only executed after this mode switch and does not incur this cost.

3.2  Monitoring TCP Connections

     On a TCP send or receive system call, in addition to identifying the thread that performs the operation, vPath also needs to log the four-element tuple (source_IP, source_port, dest_IP, dest_port) that uniquely identifies the TCP connection. This information helps match a send operation in the message source component with the corresponding receive operation in the message destination component. The current vPath prototype adds a hypercall in the guest OS to deliver this information down to the VMM. Upon entering a system call of interest, the modified guest OS maps the socket descriptor number into (source_IP, source_port, dest_IP, dest_port), and then invokes the hypercall to inform the VMM.
     This approach works well in the current prototype, and it modifies fewer than 100 lines of source code in the guest OS (Linux). However, our end goal is to implement a pure VMM-based solution that does not modify the guest OS at all. Such a pure solution would be easier to deploy in a Cloud Computing platform such as EC2 [2], because it only modifies the VMM, over which the platform service provider has full control.
     As part of our future work, we are exploring several techniques to avoid modifying the guest OS. Our early results show that, by observing TCP/IP packet headers in Domain0, four-element TCP identifiers can be mapped to socket descriptor numbers observed in system calls with high accuracy. Another alternative technique we are exploring is to have the VMM keep track of the mapping from socket descriptor numbers to four-element TCP identifiers, by monitoring system calls that affect this mapping, including bind(), accept(), connect(), and close().
 
Figure 5: Format of vPath log data. The example shows two system calls (events 0733 and 0735). For each system call, a hypercall immediately follows (events 0734 and 0736). The IP and port information provided by the hypercall helps identify TCP connections. In the system call log, EAX holds system call number. EBX holds socket descriptor number for read, and write. If EAX is 102 (i.e., socketcall), then EBX is the subclass of the system call (e.g. send or recv).

3.3  Offline Log Analyzer

     The offline log analyzer parses logs generated by the online monitor to extract request-processing paths and their performance characteristics. The analyzer's algorithm is shown in Algorithm 1. The format of input data is shown in Figure 5.
     On Line 2 of Algorithm 1, it verifies whether the trace file is in a correct format. On Line 3, it merges the system call log and the hypercall log into a single one for ease of processing. All events are then read into linked lists L on Line 4.
     Events are normalized prior to actual processing. If an application-level message is large, it may take multiple system calls to send the message. Similarly, on the destination, it may take multiple system calls to read in the entire message. These consecutive send or recv events logically belong to a single operation. On Line 5, multiple consecutive send events are merged into a single one. Consecutive recv events are merged similarly.
     On Line 6, UpdateRecvTime performs another type of event normalization. It updates the timestamp of a recv event to reflect the end of the receive operation rather than the beginning of the operation. The vPath online monitor records a timestamp for each system call of interest when it is invoked. When a thread sends out a request message and waits for the reply, this event is recorded by vPath and the thread may wait in the blocked state for a long time. To accurately calculate the response time of this remote invocation from the caller side, we need to know when the recv operation returns rather than when it starts. For a recv system call r performed by a thread T, we simply use the timestamp of the next system call invoked by thread T as the return time of r.
     The operation from Line 10 to 17 pairs up a send event at the message source with the corresponding recv event at the message destination. Once a pair of matching events ec and ed are identified, the same TCP connection's events after ec and ed are paired up sequentially by PairUpFollowings.
     Inside FindRemoteMatchingEvent on Line 13, it uses a four-element tuple (source_IP, source_port, dest_IP, dest_port) to match a TCP connection tcp1 observed on a component c1 with a TCP connection tcp2 observed on another component c2. Suppose c1 is the client side of the TCP connection. The first send operation over tcp1 observed on c1 matches with the first recv operation over tcp2 observed on c2, and so forth. There is one caveat though. Because port numbers are reused across TCP connections, it is possible that two TCP connections that exist at different times have identical (source_IP, source_port, dest_IP, dest_port). For example, two TCP connections tcp2 and tcp2' that exist on c2 at different times both can potentially match with tcp1 on c1. We use timestamps to solve this problem. Note that the lifetimes of tcp2 and tcp2' do not overlap and must be far apart, because in modern OS implementations, the ephemeral port used by the client side of a TCP connection is reused only after the entire pool of ephemeral ports have been used, which takes hours or days even for a busy server. This allows a simple solution in vPath. Between tcp2 and tcp2', we match tcp1 with the one whose lifetime is closest to tcp1. This solution does not require very accurate clock synchronization between hosts, because the lifetimes of tcp2 and tcp2' are far apart.
     On Line 19, all user requests are identified and assigned unique IDs. It goes through events and looks for foreign IP addresses that do not belong to VMs monitored by vPath. Events with foreign IP addresses are generated at front-end components and represent entry/exit points of user requests.
     Starting from Line 20, paths are constructed by processing user requests one by one. The algorithm consists of two for loops, which implements intra-node discovery and inter-node discovery, respectively. In the first loop, the starting event and ending event of a given request are identified through FindRequestBoundary. All events between them and with the same thread ID are assigned the same user request ID. In the second loop (for inter-node discovery), FindRequestBoundary is called again to find the starting event and the ending event of every user request. For each event ek that belongs to the user request, GetRemoteMatchingEvent uses information computed on Line 13 to find the matching event el at the other end of the TCP connection. Event el is assigned event ek's user request ID. This process repeats until every event is assigned a user request ID.

4  Experimental Evaluation

     Our experimental testbed consists of Xen VMMs (v3.1.0) hosted on Dell servers connected via Gigabit Ethernet. Each server has dual Xeon 3.4 GHz CPUs with 2 MB of L1 cache and 3 GB RAM. Each of our servers hosts several virtual machines (VMs) with each VM assigned 300 MB of RAM. We use the xentop utility in Domain0 to obtain the CPU utilization of all the VMs running on that server.

4.1  Applications

     To demonstrate the generality of vPath, we evaluate vPath using a diverse set of applications written in different programming languages (C, Java, and PHP), developed by communities with very different backgrounds.
 
fig/tpcw_setup.png
Figure 6: The topology of TPC-W.

     TPC-W:   To evaluate the applicability of vPath for realistic workloads, we use a three-tier implementation of the TPC-W benchmark [27], which represents an online bookstore developed at New York University [31]. Our chosen implementation of TPC-W is a fully J2EE compliant application, following the "Session Facade" design pattern. The front-end is a tier of Apache HTTP servers configured to load balance the client requests among JBoss servers in the middle tier. JBoss 3.2.8SP1 [14] is used in the middle tier. MySQL 4.1 [17] is used for the back-end database tier. The topology of our TPC-W setup is shown in Figure 6. We use the workload generator provided with TPC-W to simulate multiple concurrent clients accessing the application.
     This setup is a heterogeneous test environment for vPath. The Apache HTTP server is written in C and is configured to use a multi-process architecture. JBoss is written in Java and MySQL is written in C.
     RUBiS:   RUBiS [24] is an e-Commerce benchmark developed for academic research. It implements an online auction site loosely modeled after eBay, and adopts a two-tier architecture. A user can register, browse items, sell items, or make a bid. It is available in three different versions: Java Servlets, EJB, and PHP. We use the PHP version of RUBiS in order to differentiate from TPC-W, which is written in Java and also does e-Commerce. Our setup uses one VM to run a PHP-enabled Apache HTTP server and another VM to run MySQL.
     MediaWiki:   MediaWiki [16] is a mainstream open source application. It is the software behind the popular Wikipedia site (wikipedia.org), which ranks in the top 10 among all Web sites in terms of traffic. As mature software, it has a large set of features, e.g., support for rich media and a flexible namespace. Because it is used to run Wikipedia, one of the highest traffic sites on the Internet, its performance and scalability have been highly optimized. It is interesting to see whether the optimizations violate the assumptions of vPath (i.e., synchronous remote invocation and event causality observable through thread activities) and hence would fail our technique. MediaWiki adopts a two-tier architecture and is written in PHP. Our setup uses one VM to run PHP-enabled Apache and another VM to run MySQL.
 
Figure 7: The topology of vApp used in evaluation.

     vApp:   vApp is our own prototype application. It is an extreme test case we designed for vPath. It can exercise vPath with arbitrarily complex request-processing paths. It is a custom multi-tier multi-threaded application written in C. Figure 7 shows an example of a three-tier vApp topology. vApp can form various topologies, with the desired number of tiers and the specified number of servers at each tier. When a server in one tier receives a request, it either returns a reply, or sends another request to one of the servers in the downstream tier. When a server receives a reply from a server in the downstream tier, it either sends another request to a server in the downstream tier, or returns a reply to the upstream tier. All decisions are made based on specified stochastic processes so that it can generate complex request-processing paths with different structures and path lengths.
     We also developed a vApp client to send requests to the front tier of the vApp servers. The client can be configured to emulate multiple concurrent sessions. As request messages travel through the components of the vApp server, the identifiers of visited components are appended to the message. When a reply is finally returned to the client, it reads those identifiers to precisely reconstruct the request-processing path, which serves as the ground truth to evaluate vPath. The client also tracks the response time of each request, which is compared with the response time estimated by vPath.
 
fig/tpcw_resp_time.png
Figure 8: CDF (cumulative distribution function) comparison of TPC-W response time.
 
fig/tpcw_cpu.png
Figure 9: CDF Comparison of TPC-W JBoss tier's CPU utilization.
 

4.2  Overhead of vPath

     We first quantify the overhead of vPath, compared with both vanilla (unmodified) Xen and log-based tracking techniques [32,25]. For the log-based techniques, we turn on logging on all tiers of TPC-W. The experiment below uses the TPC-W topology in Figure 6.
 
Response time in seconds Throughput(req/sec)
 Configuration  (Degradation in %) (Degradation in %)
Average 90th percentile Average
Vanilla Xen 4.45 11.58 4.88
vPath 4.72 (6%) 12.28 (6%) 4.59 (6%)
App Logging 10.31 (132%)  23.95 (107%) 4.10 (16%)
Table 1: Response time and throughput of TPC-W. "App Logging" represents a log-based tracking technique that turns on logging on all tiers of TPC-W.

     Overhead of vPath on TPC-W.   Table 1 presents the average and 90th percentile response time of TPC-W as seen by the client, catering to 100 concurrent user sessions. For all configurations, 100 concurrent sessions cause near 100% CPU utilization at the database tier. Table 1 shows that vPath has low overhead. It affects throughput and average response time by only 6%. By contrast, "App Logging" decreases throughput by 16% and increases the average response time by as high as 132%. The difference in response time is more clearly shown in Figure 8, where vPath closely follows "vanilla Xen", whereas "App Logging" significantly trails behind.
     Figure 9 shows the CPU utilization of the JBoss tier when the database tier is saturated. vPath has negligible CPU overhead whereas "App Logging" has significant CPU overhead. For instance, vPath and "vanilla Xen" have almost identical 90th percentile CPU utilization (13.6% vs. 14.4%), whereas the 90th percentile CPU utilization of "App Logging" is 29.2%, more than twice that of vPath. Thus, our technique, by eliminating the need for using application logging to trace request-processing paths, improves application performance and reduces CPU utilization (and hence power consumption) for data centers. Moreover, vPath eliminates the need to repeatedly write custom log parsers for new applications. Finally, vPath can even work with applications that cannot be handled by log-based discovery methods because those applications were not developed with this requirement in mind and do not generate sufficient logs.
     Overhead of vPath on RUBiS.   Due to space limitation, we report only summary results on RUBiS. Table 2 shows the performance impact of vPath on RUBiS. We use the client emulator of RUBiS to generate workload. We set the number of concurrent user sessions to 900 and set user think time to 20% of the original value in order to drive the CPU of the Apache tier (which runs PHP) to 100% utilization. vPath imposes low overhead on RUBiS, decreasing throughput by only 5.6%.
 
Response Time in millisec Throughput in req/sec
(Degradation in %) (Degradation in %)
Vanilla Xen 597.2 628.6
vPath 681.8 (14.13%) 593.4 (5.60%)
Table 2: Performance impact of vPath on RUBiS.
 
Response time (in sec) Throughput (req/sec)
Configuration Avg(Std.)  Overhead   Avg(Std.)  Overhead  
Vanilla Xen 1.69(.053) 2915.1(88.9)
 (1) Intercept Syscall  1.70(.063) .7% 2866.6(116.5) 1.7%
(2) Hypercall            1.75(.050) 3.3%  2785.2(104.6)  4.5%
(3) Transfer Log       2.02(.056) 19.3% 2432.0(58.9) 16.6%
(4) Disk Write          2.10(.060) 23.9% 2345.4(62.3) 19.1%
Table 3: Worst-case overhead of vPath and breakdown of the overhead. Each row represents the overhead of the previous row plus the overhead of the additional operation on that row.

     Worst-case Overhead of vPath.   The relative overhead of vPath depends on the application. We are interested in knowing the worst-case overhead (even if the worst case is unrealistic for practical systems).
     The relative overhead of vPath can be calculated as [v/(v+p)], where v is vPath's processing time for monitoring a network send or receive operation, and p is the application's processing time related to this network operation, e.g., converting data retrieved from the database into HTML and passing the data down the OS kernel's network stack. vPath's relative overhead is highest for an application that has lowest processing time p. We use a tiny echo program to represent such a worst-case application, in which the client sends a one-byte message to the server and the server echoes the message back without any processing. In our experiment, the client creates 50 threads to repeatedly send and receive one-byte messages in a busy loop, which fully saturates the server's CPU.
     When the application invokes a network send or receive system call, vPath performs a series of operations, each of which introduces some overhead: (1) intercepting system call in VMM, (2) using hypercall to deliver TCP information (src_IP, src_port, dest_IP, dest_port) from guest OS to VMM, (3) transferring log data from VMM to Domain0, and (4) Domain0 writing log data to disk. These operations correspond to different rows in Table 3, where each row represents the overhead of the previous row plus the overhead of the additional operation on that row.
     Table 3 shows that intercepting system calls actually has negligible overhead (1.7% for throughput). The biggest overhead is due to transferring log data from VMM to Domain0. This step alone degrades throughput by 12.1%. Our current implementation uses VMM's printk() to transfer log data to Domain0, and we are exploring a more efficient implementation. Combined together, the operations of vPath degrade throughput by 19.1%. This is the worst-case for a contrived tiny "application." For real applications, throughput degradation is much lower, only 6% for TPC-W and 5.6% for RUBiS.

4.3  Request-Processing Paths of vApp

     Our custom application vApp is a test case designed to exercise vPath with arbitrarily complex request-processing paths. We configure vApp to use the topology in Figure 7. The client emulates 10-30 concurrent user sessions. In our implementation, as a request message travels through the vApp servers, it records the actual request-processing path, which serves as the ground truth to evaluate vPath.
 
Figure 10: Examples of vApp's request-processing paths discovered by vPath. The circled numbers correspond to VM IDs in Figure 7.
fig/toy_perf.png
Figure 11: CDF of vApp's response time, as estimated by vPath and actually measured by the vApp client.

     The request-processing path of vApp, as described in 4.1, is designed to be random. To illustrate the ability of our technique to discover sophisticated request-processing paths, we present two discovered paths in Figure 10. The simple path consists of 2 remote invocations in a linear structure, while the complex path consists of 7 invocations and visits some components more than once.
     In addition to discovering request-processing paths, vPath can also accurately calculate the end-to-end response times as well as the time spent on each tier along a path. This information is helpful in debugging distributed systems, e.g., identifying performance bottlenecks and abnormal requests. Figure 11 compares the end-to-end response time estimated by vPath with that actually measured by the vApp client. The response time estimated by vPath is almost identical to that observed by the client, but slightly lower. This small difference is due to message delay between the client and the first tier of vApp, which is not tracked by vPath because the client runs on a server that is not monitored by vPath.
     We executed a large number of requests at different session concurrency levels. We also experimented with topologies much larger than that in Figure 7, with more tiers and more servers in each tier. All the results show that vPath precisely discovers the path of each and every executed request.

4.4  Request-Processing Paths of TPC-W

     The three-tier topology (see the top of Figure 12) of the TPC-W testbed is static, but its request-processing paths are dynamic and can vary, depending on which JBoss server is accessed and how many queries are exchanged between JBoss and MySQL. The TPC-W client generates logs that include the total number of requests, current session counts, and individual response time of each request, which serve as the ground truth for evaluating vPath. In addition to automated tests, for the purpose of careful validation, we also conduct eye-examination on some samples of complex request-processing paths discovered by vPath and compare them with information in the application logs.
 
Figure 12: Typical request-processing paths of TPC-W.

     vPath is able to correctly discover all request-processing paths with 100% completeness and 100% accuracy (see Section 2.1 for the definition). We started out without knowing how the paths of TPC-W would look. From the results, we were able to quickly learn the path structure without any knowledge of the internals of TPC-W. Typical request-processing paths of TPC-W have the structure in Figure 12.
     We observe two interesting things that we did not anticipate. First, when processing one request, JBoss makes a large number of invocations to MySQL. Most requests fall into one of two types. One type makes about 20 invocations to MySQL, while the other type makes about 200 invocations. These two types represent radically different TPC-W requests.
     The second interesting observation with TPC-W is that, both JBoss and Apache send out replies in a pipeline fashion (see Figure 12). For example, after making the last invocation to MySQL, JBoss reads in partial reply from MySQL and immediately sends it to Apache. JBoss then reads and sends the next batch of replies, and so forth. This pipeline model is an effort to reduce memory buffer, avoid memory copy, and reduce user-perceived response time. In this experiment, once JBoss sends the first partial reply to Apache, it no longer makes invocations to MySQL (it only reads more partial replies from MySQL for the previous invocation). vPath is general enough to handle an even more complicated case, where JBoss sends the first partial reply to Apache, and then makes more invocations to MySQL in order to retrieve data for constructing more replies. Even for this complicated, hypothetical case, all the activities will still be correctly assigned to a single request-processing path.
 
Figure 13: Typical request-processing paths of RUBiS.

4.5  Request-Processing Paths of RUBiS and MediaWiki

     Unlike TPC-W, which is a benchmark intentionally designed to exercise a breadth of system components associated with e-Commerce environments, RUBiS and MediaWiki are designed with practicality in mind, and their request-processing paths are actually shorter and simpler than those of TPC-W.
     Figure 13 shows the typical path structure of RUBiS. With vPath, we are able to make some interesting observations without knowing the implementation details of RUBiS. We observe that a client request first triggers three rounds of messages exchanged between Apache and MySQL, followed by the fourth round in which Apache retrieves a large amount of data from MySQL. The path ends with a final round of messages exchanged between Apache and MySQL. The pipeline-style partial message delivery in TPC-W is not observed in RUBiS. RUBiS and TPC-W also differ significantly in their database access patterns. In TPC-W, JBoss makes many small database queries, whereas in RUBiS, Apache retrieves a large amount of data from MySQL in a single step (the fourth round). Another important difference is that, in RUBiS, many client requests finish at Apache without triggering database accesses. These short requests are about eight times more frequent than the long ones. Finally, in RUBiS, Apache and MySQL make many DNS queries, which are not observed in TPC-W.
     For MediaWiki, the results of vPath show that very few requests actually reach all the way to MySQL, while most requests are directly returned by Apache. This is because there are many static contents, and even for dynamic contents, MediaWiki is heavily optimized for effective caching. For a typical request that changes a wiki page, the PHP module in Apache makes eight accesses to MySQL before replying to the client.

4.6  Discussion on Benchmark Applications

     We started the experiments with little knowledge of the internals of TPC-W, RUBiS and MediaWiki. During the experimentation, we did not read their manuals or source code. We did not modify their source code, bytecode, or executable binary. We did not try to understand their application logs or write parsers for them. We did not install any additional application monitoring tools such as IBM Tivoli or HP OpenView. In short, we did not change anything in the user space.
     Yet, with vPath, we were able to make many interesting observations about the applications. Especially, different behaviors of the applications made us wonder, in general how to select "representative" applications to evaluate systems performance research. TPC-W is a widely recognized de facto e-Commerce benchmark, but its behavior differs radically from the more practical RUBiS and MediaWiki. This discrepancy could result from the difference in application domain, but it is not clear whether the magnitude of the difference is justified. We leave it as an open question rather than a conclusion.
     This question is not specific to TPC-W. For example, the Trade6 benchmark [35] developed by IBM models an online stock brokerage Web site. We have intimate knowledge of this application. As both a benchmark and a testing tool, it is intentionally developed with certain complexity in mind in order to fully exercise the rich functions of WebSphere Application Server. It would be interesting to know, to what degree the conclusions in systems performance research are misguided by the intentional complexity in benchmarks such as TPC-W and Trade6.

5  Related Work

     There is a large body of work related to request-processing path discovery. They can be broadly classified into two categories: statistical inference and system-dependent instrumentation. The statistical approach takes readily available information (e.g., the arrival time of network packets) as inputs, and infers request-processing paths in a "most likely" way. Its accuracy degrades as the workload increases, because activities of concurrent requests are mingled together and hard to differentiate. The instrumentation approach may accurately discover request-processing paths, but its applicability is limited due to its intrusive nature. It requires knowledge (and often source code) of the specific middleware or applications in order to do instrumentation.

5.1  Statistical Inference

     Aguilera et al. [1] proposed two algorithms for debugging distributed systems. The first algorithm finds nested RPC calls and uses a set of heuristics to infer the causality between nested RPC calls, e.g., by considering time difference between RPC calls and the number of potential parent RPC calls for a given child RPC call. The second algorithm only infers the average response time of components; it does not build request-processing paths.
     WAP5 [21] intercepts network related system calls by dynamically re-linking the application with a customized system library. It statistically infers the causality between messages based on their timestamps. By contrast, our method is intended to be precise. It monitors thread activities in order to accurately infer event causality.
     Anandkumar et al. [3] assumes that a request visits distributed components according to a known semi-Markov process model. It infers the execution paths of individual requests by probabilistically matching them to the footprints (e.g., timestamped request messages) using the maximum likelihood criterion. It requires synchronized clocks across distributed components. Spaghetti is evaluated through simulation on simple hypothetical process models, and its applicability to complex real systems remains an open question.
     Sengupta et al. [25] proposed a method that takes application logs and a prior model of requests as inputs. However, manually building a request-processing model is non-trivial and in some cases prohibitive. In some sense, the request-processing model is in fact the information that we want to acquire through monitoring. Moreover, there are difficulties with using application logs as such logs may not follow any specific format and, in many cases, there may not even be any logs available.
     Our previous work [32] takes an unsupervised learning approach to infer attributes (e.g., thread ID, time, and Web service endpoint) in application logs that can link activities observed on individual servers into end-to-end paths. It requires synchronized clocks across distributed components, and the discovered paths are only statistically accurate.

5.2  System-dependent Instrumentation

     Magpie [4] is a tool-chain that analyzes event logs to infer a request's processing path and resource consumption. It can be applied to different applications but its inputs are application dependent. The user needs to modify middleware, application, and monitoring tools in order to generate the needed event logs. Moreover, the user needs to understand the syntax and semantics of the event logs in order to manually write an event schema that guides Magpie to piece together events of the same request. Magpie does kernel-level monitoring for measuring resource consumption, but not for discovering request-processing paths.
     Pip [20] detects problems in a distributed system by finding discrepancies between actual behavior and expected behavior. A user of Pip adds annotations to application source code to log messaging events, which are used to reconstruct request-processing paths. The user also writes rules to specify the expected behaviors of the requests. Pip then automatically checks whether the application violates the expected behavior.
     Pinpoint [9] modifies middleware to inject end-to-end request IDs to track requests. It uses clustering and statistical techniques to correlate the failures of requests to the components that caused the failures.
     Chen et al. [8] used request-processing paths as the key abstraction to detect and diagnose failures, and to understand the evolution of a large system. They studied three examples: Pinpoint, ObsLogs, and SuperCall. All of them do intrusive instrumentation in order to discover request-processing paths.
     Stardust [30] uses source code instrumentation to log application activities. An end-to-end request ID helps recover request-processing paths. Stardust stores event logs into a database, and uses SQL statements to analyze the behavior of the application.

5.3  Inferring Dependency from System Call

     BackTracker [15] is a tool that helps find the source event of an intrusion, backtracking from the point when the intrusion is detected. It logs system calls to help infer dependency between system resources, but does not monitor thread activities and network operations.
     Taser [12] is a system that helps recover files damaged by an intrusion. Like BackTracker, it also uses information logged from system calls to infer the dependency of system resources. It monitors network operations, but does not monitor thread activities and does not attempt to precisely infer message causality. Moreover, both BackTracker and Taser are designed for a single server. They do not track dependency across servers.
     Kai et al. [26] proposed a method that uses an optional field of TCP packets to track inter-node causality, and assumes that intra-node causality is only introduced by process/thread forking. As a result, this method cannot handle the case where intra-node causality is caused by thread synchronization, e.g., a dispatcher thread wakes up a worker thread to process an incoming request. This is a wide used programming pattern in thread pooling.

6  Concluding Remarks

     We studied the important problem of finding end-to-end request-processing paths in distributed systems. We proposed a method, called vPath, that can precisely discover request-processing paths for most of the existing mainstream software. Our key observation is that the problem of request-processing path discovery can be radically simplified by exploiting programming patterns widely adopted in mainstream software: (1) synchronous remote invocation, and (2) assigning a thread to do most of the processing for an incoming request.
     Following these observations to infer event causality, our method can discover request-processing paths from minimal information recorded at runtime-which thread performs a send or receive system call over which TCP connection. This information can be obtained efficiently in either OS kernel or VMM without modifying any user-space code.
     We demonstrated the generality of vPath by evaluating with a diverse set of applications (TPC-W, RUBiS, MediaWiki, and the home-grown vApp) written in different programming languages (C, Java, and PHP). vPath's online monitor is lightweight. We found that activating vPath affects the throughput and average response time of TPC-W by only 6%

Acknowledgments

Part of this work was done during Byung Chul Tak's summer internship at IBM. We thank IBM's Yaoping Ruan for helpful discussions and Fausto Bernardini for the management support. We thank the anonymous reviewers and our shepherd Landon Cox for their valuable feedback. The PSU authors were funded in part by NSF grants CCF-0811670, CNS-0720456, and a gift from Cisco, Inc.

References

[1]
M. K. Aguilera, J. C. Mogul, J. L. Wiener, P. Reynolds, and A. Muthitacharoen. Performance debugging for distributed systems of black boxes. In SOSP'03: Proceedings of the 19th Symposium on Operating Systems Principles, pages 74-89, New York, NY, USA, 2003. ACM.
[2]
Amazon Elastic Compute Cloud. https://aws.amazon.com/ec2/.
[3]
A. Anandkumar, C. Bisdikian, and D. Agrawal. Tracking in a spaghetti bowl: monitoring transactions using footprints. In SIGMETRICS '08: Proceedings of the 2008 ACM SIGMETRICS international conference on Measurement and modeling of computer systems, pages 133-144, New York, NY, USA, 2008. ACM.
[4]
P. Barham, A. Donnelly, R. Isaacs, and R. Mortier. Using magpie for request extraction and workload modelling. In OSDI'04: Proceedings of the 6th conference on Symposium on Opearting Systems Design & Implementation, Berkeley, CA, USA, 2004. USENIX Association.
[5]
P. Barham, B. Dragovic, K. Fraser, S. Hand, T. Harris, A. Ho, R. Neugebuer, I. Pratt, and A. Warfield. Xen and the Art of Virtulization. In Proceedings of the 19th Symposium on Operating Systems Principles (SOSP), 2003.
[6]
R. V. Behren, J. Condit, and E. Brewer. Why Events Are A Bad Idea (for high-concurrency servers). In Proceedings of HotOS IX, 2003.
[7]
R. V. Behren, J. Condit, F. Zhou, G. C. Necula, and E. Brewer. Capriccio: scalable threads for internet services. In In Proceedings of the 19th ACM Symposium on Operating Systems Principles. ACM Press, 2003.
[8]
M. Y. Chen, A. Accardi, E. Kiciman, J. Lloyd, D. Patterson, A. Fox, and E. Brewer. Path-based faliure and evolution management. In NSDI'04: Proceedings of the 1st conference on Networked Systems Design and Implementation, Berkeley, CA, USA, 2004. USENIX Association.
[9]
M. Y. Chen, E. Kiciman, E. Fratkin, A. Fox, and E. Brewer. Pinpoint: Problem determination in large, dynamic internet services. In DSN '02: Proceedings of the 2002 International Conference on Dependable Systems and Networks, pages 595-604, Washington, DC, USA, 2002. IEEE Computer Society.
[10]
C. Clark, K. Fraser, S. Hand, J. G. Hansen, E. Jul, C. Limpach, I. Pratt, and A. Warfield. Live Migration of Virtual Machines. In NSDI'05: Proceedings of the 2nd conference on Networked Systems Design & Implementation, 2005.
[11]
T. Erl. Service-oriented architecture. Prentice Hall, 2004.
[12]
A. Goel, K. Po, K. Farhadi, Z. Li, and E. de Lara. The taser intrusion recovery system. In SOSP '05: Proceedings of the 20th ACM Symposium on Operating Systems Principles, pages 163-176, New York, NY, USA, 2005. ACM.
[13]
IBM SOA Infrastructure Consulting Services. https://www-935.ibm.com/services/us/its/pdf/br_infrastructure-architecture-healthcheck-for-soa.pdf.
[14]
The JBoss Application Server. https://www.jboss.org.
[15]
S. T. King and P. M. Chen. Backtracking Intrusions. In SOSP'03: Proceedings of the 19th ACM Symposium on Operating Systems Principles, pages 74-89, New York, NY, USA, 2003. ACM.
[16]
MediaWiki. https://www.mediawiki.org.
[17]
MySQL. https://www.mysql.com.
[18]
V. S. Pai, P. Druschel, and W. Zwaenepoel. Flash: an efficient and portable web server. In ATEC '99: Proceedings of USENIX Annual Technical Conference, Berkeley, CA, USA, 1999. USENIX Association.
[19]
W. D. Pauw, R. Hoch, and Y. Huang. Discovering conversations in web services using semantic correlation analysis. volume 0, pages 639-646, Los Alamitos, CA, USA, 2007. IEEE Computer Society.
[20]
P. Reynolds, C. Killian, J. L. Wiener, J. C. Mogul, M. A. Shah, and A. Vahdat. Pip: detecting the unexpected in distributed systems. In NSDI'06: Proceedings of the 3rd conference on Networked Systems Design & Implementation, Berkeley, CA, USA, 2006. USENIX Association.
[21]
P. Reynolds, J. L. Wiener, J. C. Mogul, M. K. Aguilera, and A. Vahdat. Wap5: black-box performance debugging for wide-area systems. In WWW '06: Proceedings of the 15th international conference on World Wide Web, pages 347-356, New York, NY, USA, 2006. ACM.
[22]
Y. Ruan and V. Pai. Making the" box" transparent: system call performance as a first-class result. In Proceedings of the USENIX Annual Technical Conference 2004. USENIX Association Berkeley, CA, USA, 2004.
[23]
Y. Ruan and V. Pai. Understanding and Addressing Blocking-Induced Network Server Latency. In Proceedings of the USENIX Annual Technical Conference 2006. USENIX Association Berkeley, CA, USA, 2006.
[24]
RUBiS. https://rubis.objectweb.org/.
[25]
B. Sengupta and N. Banerjee. Tracking transaction footprints for non-intrusive end-to-end monitoring. Autonomic Computing, International Conference on, 0:109-118, 2008.
[26]
K. Shen, M. Zhong, S. Dwarkadas, C. Li, C. Stewart, and X. Zhang. Hardware counter driven on-the-fly request signatures. In ASPLOS XIII: Proceedings of the 13th international conference on Architectural Support for Programming Languages and Operating Systems, pages 189-200, New York, NY, USA, 2008. ACM.
[27]
W. Smith. TPC-W: Benchmarking An Ecommerce Solution. https://www.tpc.org/information/other/techarticles.asp.
[28]
C. Stewart and K. Shen. Performance Modeling and System Management for Multi-component Online Services. In Proceedings of the 2nd Symposium on NSDI'05, Boston MA, May 2005.
[29]
C. Tang, M. Steinder, M. Spreitzer, and G. Pacifici. A Scalable Application Placement Algorithm for Enterprise Data Centers. In WWW, 2007.
[30]
E. Thereska, B. Salmon, J. Strunk, M. Wachs, M. Abd-El-Malek, J. Lopez, and G. R. Ganger. Stardust: tracking activity in a distributed storage system. In SIGMETRICS '06/Performance '06: Proceedings of the joint international conference on Measurement and modeling of computer systems, New York, NY, USA, 2006. ACM.
[31]
NYU TPC-W. https://www.cs.nyu.edu/pdsg/.
[32]
T. Wang, C. shing Perng, T. Tao, C. Tang, E. So, C. Zhang, R. Chang, and L. Liu. A temporal data-mining approach for discovering end-to-end transaction flows. In 2008 IEEE International Conference on Web Services (ICWS08)., Beijing, China, 2008.
[33]
M. Welsh. A Note on the status of SEDA. https://www.eecs.harvard.edu/~mdw/proj/seda/.
[34]
M. Welsh, D. Culler, and E. Brewer. Seda: an architecture for well-conditioned, scalable internet services. SIGOPS Oper. Syst. Rev., 35(5):230-243, 2001.
[35]
H. Yu, J. Moreira, P. Dube, I. Chung, and L. Zhang. Performance Studies of a WebSphere Application, Trade, in Scale-out and Scale-up Environments. In Third International Workshop on System Management Techniques, Processes, and Services (SMTPS), IPDPS, 2007.