2007 USENIX Annual Technical Conference
Pp. 247–260 of the Proceedings


Evaluating Block-level Optimization through the IO Path
| Alma Riska |
James Larkby-Lahet |
Erik Riedel |
| Seagate Research |
Computer Science Dept. |
Seagate Research |
| 1251 Waterfront Place |
University of Pittsburgh |
1251 Waterfront Place |
| Pittsburgh, PA 15222 |
Pittsburgh, PA 15260 |
Pittsburgh, PA 15222 |
| Alma.Riska@seagate.com |
jamesll@cs.pitt.edu |
Erik.Riedel@seagate.com |
This paper focuses on evaluation of the effectiveness of optimization
at various layers of the IO path, such as the file system,
the device driver scheduler, and the disk drive itself.
IO performance is enhanced via effective block allocation at the
file system, request merging and reordering at the device driver,
and additional complex request reordering at the disk drive.
Our measurements show that effective combination of these optimization
forms yields superior performance under specific workloads.
In particular, the impact on IO performance of technological advances
in modern disk drives (i.e., reduction on head positioning times and
deployment of complex request scheduling) is shown.
For example, if the outstanding requests in the IO subsystem can all be
accommodated by the disk queue buffer then disk level request
scheduling is as effective as to close any gaps in the performance
between IO request schedulers at the device driver level.
Even more, for disk drives with write through caches, large queue depths
improve overall IO throughput and when combined with the best performing
disk scheduling algorithm at the device driver level, perform comparably
with an IO subsystem where disks have write-back caches.
1 Introduction
The IO hierarchy has grown long and complex as its main goal
is to close as much as possible the performance gap between memory
and disk drives. While this gap has remained significant, the amount
of resources added in the IO path has increased and allows for advanced
optimization in various levels of the IO path. In this paper, we take
a look at the effectiveness of various optimization techniques
applied at main components of the IO path such as the file system,
the device driver scheduler, and the disk drives themselves.
In particular, our focus is reordering of IO activity throughout
the IO subsystem to improve IO performance.
Reordering of the IO work is non-work conserving because the overhead
of disk head positioning associated with each disk request is different
with different request schedules.
Hence it becomes critically important to order the same set of requests
such that the overall IO work is minimized.
Early on, disk scheduling aimed at minimizing the linear disk head
movement (i.e., seeks) [3,4,7,20]
and later evolved to minimizing the overall head positioning
phase of a disk request service [1,10,21].
Request reordering can take place effectively only at certain
layers of the IO path, which is commonly composed of a device driver,
an array controller, and multiple disks that communicate with each-other
through interfaces such as SCSI.
For example, seek-based request reordering is traditionally done at
the device driver and/or array controller,
while position-based request reordering can only be done at the disk
level where the accurate information about head's position is available.
In addition to effective reordering of IO requests, IO optimization techniques
aim at reducing the number of requests sent down the IO path, by exploiting the
temporal and spatial locality in the stream of requests and merging consecutive
ones.
Request merging enhances IO performance because it reduces the overall
head positioning overhead which is associated with each request and
it is independent of the request size.
Actually, the current default disk scheduler for Linux is
Anticipatory [9],
which even waits idle, if necessary, to fully explore the sequentiality
in the stream of IO requests.
In this paper, we focus on identification of the IO path layers, where
specific IO optimization techniques are effective.
For this, we conduct measurements in a system whose IO hierarchy
consists of the file system, device driver, and the disk itself.
Experimenting with an array controller in this path did not indicate
qualitatively different results and we opted not to include it in the
IO path for the bulk of the experiments.
The effectiveness of IO optimization is evaluated at the application
level by quantifying the effect that request merging and reordering at
different IO layers have on overall system performance.
We find that effective request merging is the key approach to achieve
the maximum throughput in the IO subsystem, under heavy load.
Although such optimization happens at the device driver level, via
scheduling, its effectiveness is determined at the file system level.
Specifically, the Reiser file system sends down more requests than all
other file systems evaluated, but after merging at the device driver
results to the smallest number of disk requests.
Consequently, ReiserFS achieves the highest application throughput,
which for a specific workload, is double the throughput of
other file systems.
Our measurements show that disk level optimization in the form of
scheduling is particularly effective and, although, disks are at
the end of the IO path, it effects the overall application throughput.
Specifically, if the load in the IO subsystem is medium,
(i.e., a scenario that diminishes the importance of request merging)
then by scheduling effectively at the disk level, one can close the
application-level performance gap resulting from ineffective scheduling
at the device driver.
The effectiveness of disk level scheduling is also noticeable when
comparing write-back and write-through disk cache policies.
While write-back is better performing with low disk queue depths,
write-through gains the performance difference as the disk queue depth
is increased, which makes the latter a more attractive alternative
given the enhanced data reliability and consistency it provides.
The rest of this paper is organized as follows.
In Section 2, we describe the measurement environment.
Section 3 explains and evaluates the applications,
that we run to generate IO load.
We analyze the file system level of the IO path in
Section 4 and the device driver level in
Section 5. The disk drive level of the IO path
is evaluated in Section 6.
We discuss related work in Section 7.
Section 8 concludes the paper by summarizing our
findings.
2 Measurement Environment
Our intention is to analyze the effectiveness of IO work optimization
throughout the IO path, which (in our case) consists of the file system,
the device driver disk scheduler, and a single disk drive.
While we did not conduct measurements with multi-disk systems,
we measured a system where the disk was attached to an array controller.
The presence of an array controller (i.e., more resources and
another level of scheduling) did not affect our results qualitatively
and is not discussed here in detail for sake of presentation clarity.
We conduct measurements in a system (i.e., Dell Power Edge 1750)
that runs the Postmark benchmark [11] on top of a Linux
operating systems (i.e., Gentoo Linux 2.6.16-git11 distribution).
Postmark is configured for four different scenarios as described in
Section 3, that generate IO workloads with different
characteristics.
Postmark loads the system heavily.
Building the Linux kernel multiple times simultaneously serves as our
second application which loads the system with a range of load levels.
We also evaluate four file systems, (Ext2, Ext3, ReiserFS, and XFS),
four disk scheduling, (No-Op, Deadline, CFQ, and Anticipatory),
and three different SCSI Seagate disk drives (Cheetah ST318453LC,
ST3146854LC, and ST3300007LC which we refer to as the 18 GB, 146 GB, and
the 300 GB disks, respectively).
Table 1 summarizes the details of our measurement testbed,
while further details for each component, such as the file systems, device
driver schedulers, and disk drives parameters, are given in the corresponding
sections later on.
Unless otherwise stated, the disks in our measurement testbed have
write-through cache enabled.
Table 1:
Specifications of the measurement system.
|
System |
Dual Intel Xeon CPU 2.40GHz, |
|
|
1GB memory, |
|
|
LSI Fusion MPT SCSI Controller |
|
OS |
Gentoo Linux 2.6.16-git11 |
|
Application |
Postmark / Linux kernel build |
|
File System |
Ext2, Ext3, ReiserFS, XFS |
|
IO scheduler |
No-Op, Deadline, CFQ, Anticipatory |
|
Disk Drive |
18 GB/15Krpm, 146 GB/15Krpm, 300 GB/10Krpm |
|
The blktrace tool that comes with the Linux 2.6 kernel module is
used to trace the IO activity at the device driver level.
The data obtained is further parsed using blkparse.
Tracing using the blk tools captures the entire activity at the
IO device driver and includes queuing a request, merging
it with an already queued request (if predefined sequentiality criteria
holds),
dispatching it to the SCSI interface, and handling its
completion. In addition to collecting and processing data
via the blk tools, we conduct our own data post-processing
to identify the work incoming to the device driver from
the file system and the work outgoing from the device driver and
completed by the disk. In our measurement system, the working set
is located in a different disk from the disk that hosts
the OS. Also the data collected via blktrace was sent through
the network and not stored in the local machine to minimize effects
to the targeted SCSI bus.
All our measurements are conducted on clean file systems. We argue that
our conclusions hold in the case of an aged file system,
because mostly our evaluation is related to the workload characteristics
within the working set. Once the working set is stationary over a period
of time then optimization depends mostly on the working set size,
request interarrival times, and randomness/sequentiality of workloads.
With Postmark and Linux kernel builds, we cover a range of workloads with
respect to working set size, request interarrival times, and
randomness/sequentiality and expect the aged
file system behavior to fall in any of the above evaluated categories.
We measure the IO subsystem performance via the application throughput.
We chose this measure of interest, because our goal is to evaluate the
overall effectiveness of combining various optimization techniques at
different levels of the IO path.
3 Application Layer
Our first application is Postmark [11], which
benchmarks the performance of e-mail, netnews,
and e-commerce classes of applications.
Postmark works on a pool of changing files, (i.e., the working set),
and generates an
IO-bound write-dominated workload.
Because Postmark heavily loads the storage subsystem,
it is our benchmark of choice for evaluating
optimization efficiency in the IO path.
Postmark generates an initial working set of random text files ranging
in size from a configurable low bound to a configurable high bound.
The range of file sizes determines Postmark's workload sequentiality
because Postmark's activity in each file is proportional to its size.
Postmark's working set is also of configurable size by specifying the
number of files in it. Postmark starts with creating the working set
(first phase). A number of transactions are executed (second
phase).
Finally, all files are deleted (third phase).
Each Postmark transaction consists of a pair of smaller transactions,
which are create file or delete file and read file or
append file.
Postmark's throughput, used here as a measure of system performance,
is the number of transactions per second during the second phase
of the benchmark execution, which represents another reason why an aged
file system with similar working set and workload characteristics
should behave similarly.
Table 2:
Postmark specifications for each workload for the 18 GB disk.
Specifications hold for the other two disks, except that for the LL
workload 40,000 transactions are completed.
|
Work |
File |
Work |
File |
No. of |
Trans- |
|
|
load |
Size |
Set |
size |
Files |
actions |
|
|
SS |
Small |
Small |
9-15 KB |
10,000 |
100,000 |
|
|
SL |
Small |
Large |
9-15 KB |
200,000 |
100,000 |
|
|
LS |
Large |
Small |
0.1-3MB |
1,000 |
20,000 |
|
|
LL |
Large |
Large |
0.1-3MB |
4,250 |
20,000 |
|
|
We benchmark four different Postmark workloads
by varying the low and high bounds of file sizes and the number of
files in the working set. We aim at having small working sets,
i.e., occupying a few percentage of the available disk space and
large working sets, i.e., occupying 25% for the largest capacity
disk (i.e, the one with 300 GB) to approximately 50% for the
smaller capacity disks ((i.e, the 18 GB and the 146 GB ones).
The working set size affects the amount of seeking that is associated
with each transaction. The working set size is controlled via the number
of files.
Although Postmark generates a workload that randomly accesses the files
within the working set (see Figure 1),
the disk-level randomness depends on the average file size in the working
set.
We get a more random workload by setting the file size boundaries to be
only a few KBytes and a more sequential workload by setting the file
size boundaries to a few MBytes. Table 2
describes in detail how Postmark is configured to generate
four different workloads. Throughout this paper,
Postmark is configured with its buffer parameter set. Exploring the
cache impact on IO performance, although important, is
not addressed here.
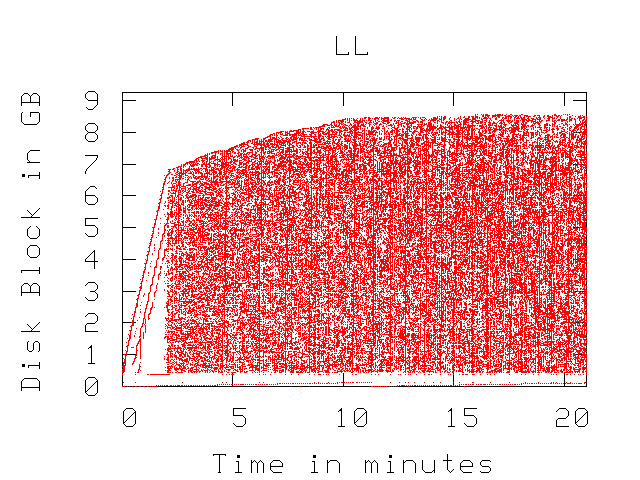
Figure 1:
Access patterns for the LL workload in Table 2.
The system configuration is: Ext3, anticipatory, and the 18 GB disk.
|
Figure 1 shows the disk access
pattern for the LL workload of Table 2,
by plotting the start LBA of each request on the y-axis as a function
of request arrival time. The other workloads have similar access patterns
and are not shown here for sake of brevity.
During the file creation phase, the disk access pattern is mostly
sequential, which in the plot appears as straight lines.
The sequentiality in this phase is one of the reasons that later
on the read and write average request
size is (in some cases) larger than the maximum file size in the
working set.
For the file access phase of the benchmark, the access pattern is
random within the working set, which appears in the plots as a block
of numerous dots (each marking a single disk request).
The SS and LS workloads are localized and entail less disk head
positioning overhead than for the SL and LL workloads.
The large working sets that span over 50% of the available space
(for the 18 GB and 146 GB disks) experience more seeking overhead.
Also the sequentiality in workloads increases with the file size
in the working set.
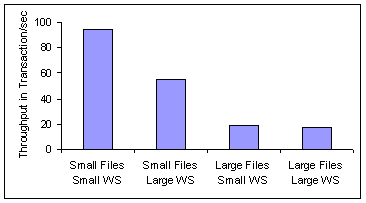
Figure 2 plots
the Postmark throughput, measured in transactions per second, during
the file access phase of the benchmark, for each of the four workloads
of Table 2.
The measurement testbed is configured with its default setting,
i.e., Ext3 file system, Anticipatory disk scheduling algorithm,
and the 18 GB disk drive with a queue depth of 4.
The highest Postmark throughput is achieved for the SS workload.
This is expected because Postmark's transaction size is linear to
the file size. Consequently, workloads with large files have
longer transactions than the workloads with small sizes.
Transaction length affects Postmark throughput by as much as 5
times (i.e., the difference between throughput under the SS
workload and throughput under the LL workload.
Figure 2:
The plot depicts Postmark's throughput in transactions
per second for the four workloads of Table 2.
The system configuration is: Ext3, anticipatory, and the
18 GB disk.
The table gives disk IOPS and bandwidth.
|
|
| Workload |
SS |
SL |
LS |
LL |
| IOPS |
424.62 |
310.87 |
278.68 |
227.91 |
| Bandwidth |
60.61 |
62.15 |
228.19 |
269.80 |
|
A similar trend is captured also by the IOs per second (IOPS)
shown in the table of Figure 2.
Again, the SS workload achieves the highest number of disk requests
completed in each second.
Between the workloads with the same file sizes, the difference in
Postmark throughput (and IOPS) is related to the seeking through
different file locations. For small working sets the seeking is
shorter than for large working sets.
The seeking overhead reduces Postmark throughput by as much as 50%.
LS and LL workloads perform similarly with regard to Postmark
throughput because their sequentiality (lack of randomness) causes the
optimization down in the IO path to be similarly (in)effective for both of
them. This is not the case for the random SS and SL workloads.
A second application that we use to benchmark the effectiveness of
the optimization in the IO path is building multiple Linux kernels
simultaneously. The Linux kernel builds yield similar access patterns
to the disk as Postmark (when it comes to randomness) but the request
interarrival times are longer and the working set spans in bands over
some area of the disk. We use this second benchmark to evaluate how
effective request merging and reordering becomes at the device
driver and the disk drive when the system is loaded moderately.
4 File System Level
In our evaluation, we conduct measurements in four different
file systems, namely, Ext2, Ext3, ReiserFS, and XFS, which are
supported by any Linux distribution.
The main characteristics of these file systems are summarized in
the following:
- Ext2 is a standard FFS-like file system, which uses
cylinder groups for data placement and single,
double, or triple indirect metadata blocks.
- Ext3 is also an FFS-like file system, whose data structures
are backward compatible with Ext2. However, Ext3 uses
a special file as a journal to enhance file system
consistency and data reliability.
- Reiser file system has also single contiguous journal and
uses a B
 -tree as its metadata structure. -tree as its metadata structure.
- XFS uses also a single contiguous journal, as well as,
allocation groups, and extent-based B-tree for
its metadata management.
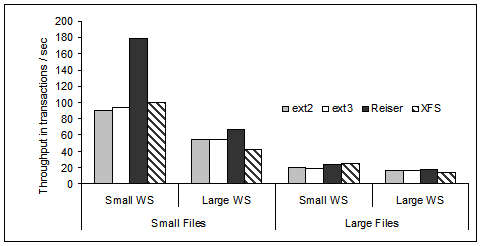
The throughput of the four different workloads described in
Table 2 under the four file systems in our
study is shown in Figure 3.
The device driver scheduler is Anticipatory, and the queue depth at
the 18 GB disk is 4.
Under the more sequential workloads, as it is the case of
the LS and LL workloads with large files, the difference in Postmark
throughput between the four file systems is minimal.
They behave very similarly because the sequentiality in the workload
provides an almost optimal ordering with little room for further
optimization at the file system level.
This is not the case for the small files workloads, which have more
randomness and consequently more room for optimization.
In particular, we observe superior Postmark performance under ReiserFS
for the SS workload with as much as twice the throughput of the other
file systems.
Figure 3:
Postmark throughput for the four file systems and the workloads of
Table 2. Measurements are done on the 18 GB disk and Anticipatory scheduling.
|
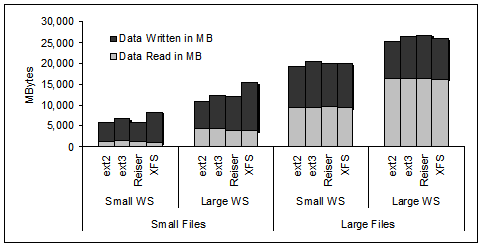
The work in MBytes of data read and written by Postmark and processed
by the file system is presented in Figure 4.
In our testbed, we do not have a measurement point in front
of the file system to exactly measure the amount of work added to
the IO subsystem by the file system itself. The work processed
by the Ext2 file system (i.e., no journaling) is the best approximation
to the Postmark generated IO workload.
With a few exceptions, there is no substantial difference in the amount
of work for either reads or writes.
In particular,
when comparing the amount of work under the Ext2 file system and
the other three file systems that maintain a journal for metadata
management.
The XFS file system seems to be an outlier when it comes to
the extra amount of work to manage the journal under the small
files workloads (see the last bar of the first two sets of bars in
Figure 4).
Because the application (i.e., the scenario under the Ext2 file system)
and the file system, approximately request the same amount of work
(either reads or writes) to be processed by the storage subsystem,
any differences in the overall application throughput
(within the same workload) as reported in
Figure 3 is attributed to the
effectiveness of work optimization in the IO path.
Figure 4:
The amount of data read and written by each file system under
the four different workloads of Table 2.
Measurements are done on the 18 GB disk and Anticipatory scheduling.
|
By changing only the file system and fixing the IO workload,
disk scheduling, disk queue depth, and other system parameters,
the measured difference in application level performance
(i.e., Postmark throughput) is attributed to the average disk
request size, since we concluded that all file systems process the same
amount of work in Figure 4.
That is because, for the same amount of data to be transferred,
the traffic composed of large disk requests has fewer requests than
the traffic composed of small disk requests.
Consequently the overhead associated with the disk head positioning
is less for the workload composed of large requests than for the
workload composed of small requests.
Although, small requests get served faster than large requests, in
all our measurements, a stream of few large requests always outperformed
a stream of many small requests.
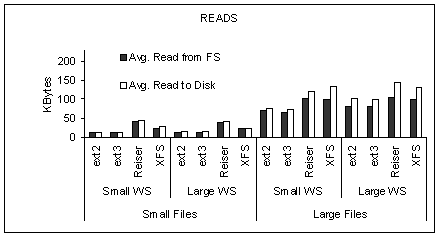
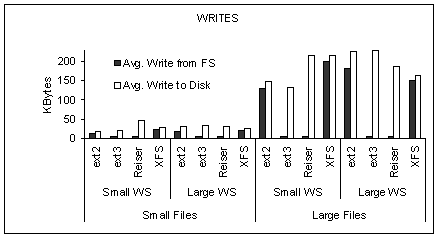
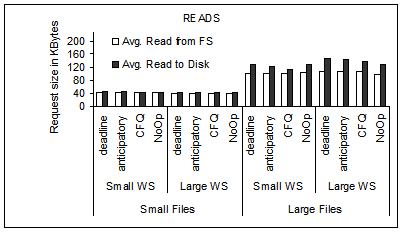
Figure 5 shows the average request size
for the four workloads in our evaluation and the four
file systems. Request size is measured in the incoming and the outgoing
traffic of the device driver which corresponds, respectively, to the
outgoing traffic of the file system and the incoming traffic at the
disk drive. The scheduler at the device driver is Anticipatory and the
disk is the 18 GB one with queue depth of 4.
Generally, write disk traffic has longer requests than read disk traffic,
in particularly for the workloads with large files.
There is noticeable difference between the average disk request size
under ReiserFS and the other three file systems.
The incoming disk traffic under ReiserFS has the largest read and write
request size.
Figure 5:
The average request size of reads and writes in the outgoing
stream of requests from the file system and the incoming request stream at the disk.
The four workloads of Table 2 are evaluated under
four file systems.
Measurements are done on the 18 GB disk and Anticipatory scheduling.
|
|
While disk read and write requests under ReiserFS are of comparable size,
the read and write requests outgoing from ReiserFS have different sizes.
ReiserFS and the other three file
systems send down the IO path requests for large reads, while only
Ext2 and XFS do the same also for writes.
Ext3 and ReiserFS send down the IO path constant size write requests
of 4 KB relying on the device driver scheduler to merge the sequential
ones.
Although, Ext3 and ReiserFS do send down to the device driver,
4 KB write requests, the outgoing write requests are larger for
ReiserFS than for Ext3.
Overall, ReiserFS is more effective at data allocation.
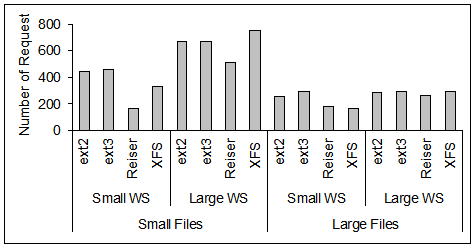
The same points made in Figure 5,
are reinforced with the results presented in Figure 6,
where we plot the number of requests in the traffic
stream incoming at the disk drive (results are similar for the stream
outgoing FS).
Note that while ReiserFS results consistently in the smallest number
of requests sent to disk, XFS (with the exception of one case) is the
second best. This indicates that the constant size write requests
sent to the device driver from the file system are not the reason for
ReiserFS superiority. Instead, block allocation and maintaining of the
journal should be considered as main factors for ReiserFS best
performance for the workloads under evaluation.
Although the final request merging does happen at the device driver
level and, as we discuss it further in the following section,
it is a characteristic that sets apart the disk schedulers at the
device driver, we stress that it is the data management within
the file system level that facilitates the effective outcome of request
merging.
Figure 6:
Number of requests in the incoming request stream at the disk,
(i.e., the outgoing request stream at the device driver).
The four workloads of Table 2 are evaluated
for four file systems.
Measurements are done on the 18 GB disk and Anticipatory scheduling.
|
Figure 5 indicates that the main
differences between the file systems are on handling write traffic
rather than read traffic. The latter is mostly handled at or above
the file system level (exploiting all the semantics available from
the application) and also the system cache availability.
Write traffic on the other hand is left to be optimized by the IO
subsystem (starting with the file system). Consequently,
the impact of write optimization on overall application throughput
is high, because Postmark workload is write-dominated.
For the reminder of this paper, we focus mostly on the effectiveness
of device driver disk scheduling and disk level queuing.
To facilitate a concise presentation, we limit ourselves on
measurements in one file system only and we choose ReiserFS because
we identified it as the most effective file system when it comes to
IO work optimization at the file system level for the workloads under
our evaluation.
5 Device Driver Level
In the previous sections, we analyzed the work generated at the
application level and its first optimization at the file system level.
In this section, we focus on the device driver level and discuss the
tools available at this level to further optimize the stream of IO
requests.
At the device driver level, request scheduling is the main tool to
optimize work. Ordering of requests in the elevator fashion reduces the
seek overhead experienced by each request sent down to the disk.
Here, we test four different disk scheduling algorithms,
which are available in any Linux distribution. Three of the disk
scheduling algorithms that we evaluate (namely, Deadline, Anticipatory,
and Command Fair Queuing) are elevator-based and the fourth one
(i.e., No-Op) is a variation of the First-Come-First-Serve algorithm
(as explained below).
Apart from ordering requests, disk scheduling algorithms
try to merge consecutive requests so that as few as possible are sent
down to the disk.
In Section 4, we discussed the
importance and the impact of IO request merging on overall system performance.
All evaluated disk scheduling algorithms differ in their
way they merge requests, and their effectiveness depends on that.
In the following, we describe in detail the four evaluated disk
scheduling algorithms:
- No-Op is a first come first serve algorithm that
merges sequential requests only if they arrive one
after the other preserving the FCFS order.
- Deadline behaves as a standard elevator algorithm, i.e.,
it orders the outstanding requests in the order of the increased
estimated seek distances, unless a read has been waiting for 300 ms
or a write has been waiting for 5 seconds.
- Anticipatory (default) is the same as Deadline, when it come
to ordering requests based on their seek distance. However sometimes
it pauses for up to 6ms, in order to avoid seeking, while waiting
for more sequential read requests to arrive.
Anticipatory is a non-work
conserving scheduler, because there are cases when it holds
the system idle although there are outstanding requests
waiting for service.
- CFQ (Command Fair Queuing) is also an elevator-based
scheduler that, that in a multi-process environment,
attempts to give every competing process the same number of
IOs per unit of time in a round-robin fashion.
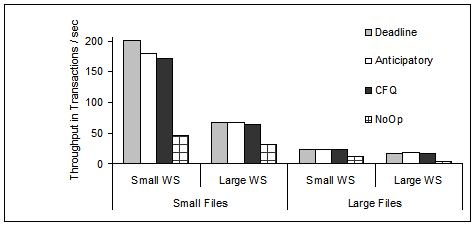
Figure 7:
Postmark throughput under four different device driver
schedulers and the four workloads of Table 2.
Measurements are done on the 18 GB disk and ReiserFS.
|
Figure 7 plots Postmark throughput
for the four different workloads of
Table 2 and the four different device driver
scheduling algorithms.
The file system is ReiserFS and the disk is the 18 GB one with a queue
depth of 4. By fixing all system parameters, such as the file system,
disk queue depth, and workload, we attribute the differences in Postmark
throughput only to the device driver disk scheduling algorithm.
Postmark throughput is clearly higher for scheduling algorithms that
reorder the IO traffic based on inter-request seek distances.
The differences are more noticeable under more random workloads
(i.e., workloads SS and SL) than under more sequential
workloads (i.e., workloads LS and LL).
No-Op is in clear disadvantage, with throughput as low as one fourth of
the best performing scheduling algorithm (under the SS and LS workloads).
As we explained earlier, this is an outcome of the non-work conserving
nature of the disk scheduling algorithms where request reordering does
result in less work to be done at the disk.
In addition, No-Op performs poorly even for the more sequential LL workload,
because it merges only consecutive sequential requests.
Among the elevator-based disk schedulers, Deadline performs the best
in our system, with a noticeable advantage only for the
SS workload where randomness is high and working set size small.
Under all scenarios that we measured at the device driver level, the
highest relative gain for a disk scheduling algorithm is approximately
20% once all other system parameters remain unchanged (this is
for the case of ReiserFS, SS workload and Deadline and Anticipatory
schedulers). This gain is much smaller than the case depicted in
Figure 3 where the file system rather
than the scheduling algorithm is the changing system parameter and
the performance gains is as much as 80% for ReiserFS when compared with
XFS under the SS workload.
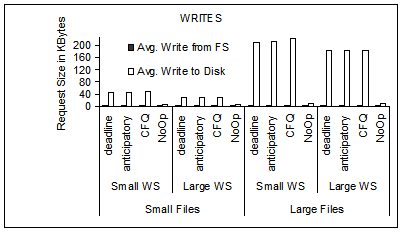
Figure 8:
Average request size of reads and writes at the device driver
for the incoming and outgoing traffic for the four workloads of
Table 2 and four scheduling algorithms.
Measurements are done on the 18 GB disk and ReiserFS.
|
|
Disk scheduling algorithms, including No-Op, merge incoming file system
requests to exploit their temporal and spatial locality.
Anticipatory scheduling is the most aggressive algorithm with
respect to merging, because it waits up to 3 ms (in our configuration)
for new read arrivals that could be merged with outstanding ones, even
though the storage system might be idle. No-Op scheduling is the least
efficient algorithm because it merges only consecutive requests that are
sequentially located on the disk.
Deadline and CFQ do not put conditions on consecutive arrivals of
sequential requests as No-Op does.
Differences in disk scheduling algorithms with respect to request
merging are depicted in Figure 8,
where we plot the average request size for the read and write traffic in
and out of the device driver for the four workloads
of Table 2 under the four different disk
scheduling algorithms. The file system is ReiserFS and the disk is the
18 GB one with a queue depth of 4.
There is a substantial difference between No-Op write request size out of
the device driver and other schedulers write request size out of the
device driver.
No-Op does not succeed to merge any write requests at all because their
sequentiality is broken by other IO requests.
In particular, under ReiserFS, which we plot in Figure 8,
No-Op is under disadvantage because the file system chops application
write requests to 4 KB.
All other disk scheduling algorithms perform comparably, because
the high IO load with short interarrival times causes these scheduling
algorithms to meet their parameter thresholds for request merging.
Generally, device driver disk scheduling merges more effectively writes than
reads for the Postmark workloads evaluated here.
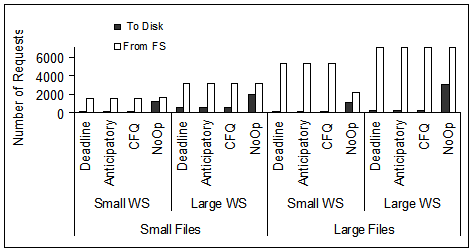
Figure 9:
Number of requests in and out of the device driver level, for
the four workloads of Table 2
and the four disk scheduling algorithms.
Measurements are done on the 18 GB disk and ReiserFS.
|
The same conclusion is drawn from the results presented in
Figure 9, where we plot
the number of requests in and out the device driver level
for each scheduler and the four workloads of
Table 2.
For the workloads that access large files (i.e., LS and LL)
the degree of merging is higher than for workloads that access
small files (i.e., SS and SL), because the workload is sequential
and, on its own, represents more opportunities for request merging.
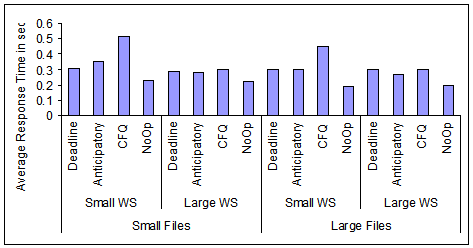
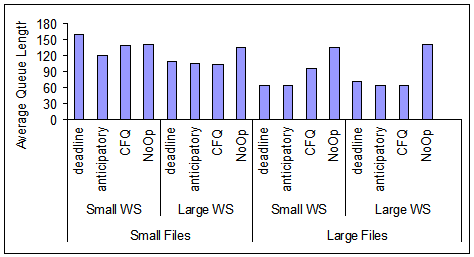
Figure 10:
Average response time and queue length
at the device driver for the four scheduling algorithms and the
four workloads of Table 2.
Measurements are done on the 18 GB disk and ReiserFS.
|
|
In Figure 10, we show the average
response time and queue length at the device driver level for the
four workloads of Table 2, the four
disk scheduling algorithms, ReiserFS, and the 18 GB disk
with queue depth of 4.
The results of Figure 10
clearly indicate that the device driver operates under very high
load with queue lengths in the hundred and response times in the
level of seconds.
Request response time under No-Op is better than under the other
scheduling algorithms because the requests and, consequently,
the disk transfer times are shorter under No-Op than under the
other disk scheduling algorithms (see Figure 8).
The difference is reflected in overall average request response
time.
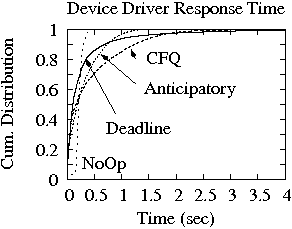
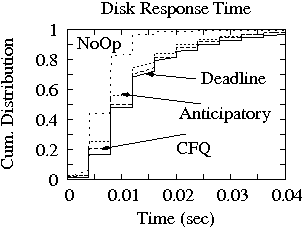
Figure 11:
Response time distribution at the device driver
and disk for the SS workload. Measurements are done on the 18 GB disk and ReiserFS.
|
|
We also plot the cumulative distribution function of response times at the
device driver and at the disk for only one workload (i.e., SS) and the four
scheduling algorithms.in Figure 11
Indeed the disk scheduling algorithms other than No-Op do introduce
more variability in the system as the distribution at the device driver
indicates. However this variability does not affect the overall system
performance since under these scheduling algorithms the
application throughput is noticeably better than under the fair No-Op scheduler.
The variability injected in the workload because of scheduling at the
device driver level, does not get more pronounced at the disk level
as the distribution of disk response time indicate. The difference
between the four device driver schedulers in the disk response time
distribution is attributed to the difference in request size between No-Op
and the other three disk schedulers.
5.1 Second application: Linux kernel build
Previously, we showed that Postmark
fully utilizes the storage subsystem
(see Figure 10).
As indicated in Section 4, under heavy load,
request merging becomes the determining factor on IO performance
and the best performer, i.e., ReiserFS, distinguishably sets itself
apart from the other file systems.
In order to evaluate behavior under lighter load conditions, we
chose to generate IO workloads by compiling the Linux 2.6 kernel,
twice and four times simultaneously.
Note that a single Linux kernel compilation in our dual
processor system performs the same as two simultaneous Linux
kernel builds and more than four simultaneous builds
load the system heavily (similarly to Postmark).
Linux kernel compilation generates a write-dominated random workload.
Different builds were placed in different disk partitions
which means that disk head positioning is involved when multiple
simultaneous builds are running. Because the average request size
is different for the Linux build measurements and the Postmark ones,
we compare the load level by looking at the request interarrival times.
While for Postmark the average interarrival time is 3 ms, for the Linux
build is 19 ms and 12 ms for the two and four simultaneous builds.
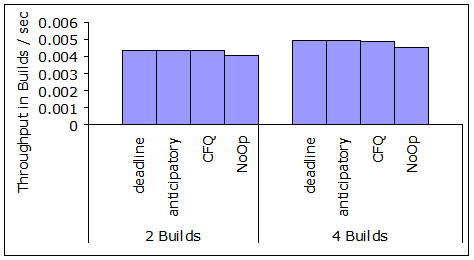
Figure 12:
Throughput in builds per second for the Linux kernel compilation
benchmark.
|
Figure 12 shows the throughput of this
benchmark measured in builds per second.
Note that the differences between the disk
scheduling algorithms at the device driver level are not as pronounced
as in the case of the heavy Postmark load. Even No-Op is not far behind
the seek-based scheduling algorithms. In the next section, we come
back to the Linux kernel build benchmark and discuss the
effectiveness of disk level request scheduling under medium IO load,
where request merging has smaller effect on IO optimization than under
the Postmark benchmark. Under the Linux build benchmark, request
reordering is of more importance than request merging.
6 Disk Drive Level
The disk drive is the last component in the IO path that we
analyze in this paper.
With the advances in chip design, modern disks have more CPU and more
memory available than before. Although various optimization techniques such
as request merging are best suited for the upper levels of the IO path
such as the file system and the device driver, the disk itself does
offer various optimization opportunities, mostly related to
caching of data and scheduling of requests.
We stress that disk scheduling at the disk level is the most effective
IO request scheduling in the IO path [21],
because it uses information on head position that is available only
at the disk drive level.
In this section, we focus on evaluating disk level scheduling by
analyzing the effectiveness of disk level queuing.
We use three different disks in our evaluation manufactured by Seagate
Technology. The main differences between them are the linear density,
rotational speed, and capacity, which determine the average head
positioning time and the associated overhead for each disk request.
Details on the three disks used in our evaluation are given in
Table 3. Note that the linear density of the
300 GB disk is approximately 24% and 64% higher than the linear
density of the 146 GB disk and the 18 GB disk, respectively, while
its average seek time is higher by approximately 30%.
Although seek time is expected to improve if disk tracks are closer
together, in the case of the 300 GB drive, the platters are larger to
accommodate the large capacity and consequently the arm itself becomes
heavier, which results in longer seek times for the 300 GB disk
than the 18 GB and 146 GB disks.
Table 3:
Specifications for the three Seagate disks.
|
|
ST318453LC |
ST3146854LC |
ST3300007LC |
|
Capacity |
18 GB |
146 GB |
300 GB |
|
RPM |
15,000 |
15,000 |
10,000 |
|
Platters |
1 |
4 |
4 |
|
Linear density |
64K TPI |
85K TPI |
105K TPI |
|
Avg seek time |
3.6/4 ms |
3.4/4 ms |
4.7/5.3 ms |
|
Cache |
8 MB |
8 MB |
8MB |
|
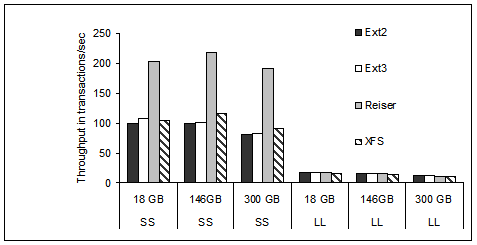
In Figure 13, we show the
Postmark throughput for the three disks of Table 3
and the SS and LL workloads of Table 2.
The file system is changed while the disk scheduling is set to
Anticipatory.
The highest application throughput is achieved for the 146 GB disk,
with the 18 GB to a close second.
The higher average seek times and the slower rotation speed cause
the 300 GB disk drive, although with the highest linear density,
to achieve the lowest application throughput among the three disk
drives.
Figure 13:
Postmark throughput for all disks of Table 3,
two of the workloads of Table 2, the four file
systems, anticipatory scheduling, and disk queue depth of 1.
|
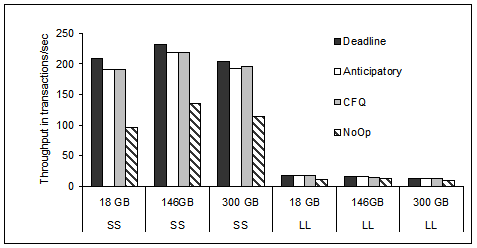
Figure 14 is similar to
Figure 13, but
now the file system is fixed to ReiserFS and the
Postmark performance is measured under four disk scheduling
algorithms.
As pointed out above, the 146 GB disk is the one performing
best under all device driver disk scheduling algorithms.
Note that the relative gap between No-Op and the other seek-based
algorithms is smaller for the newer disks (i.e., 146 GB and 300 GB)
than the older one (i.e., 18 GB).
Figure 14:
Postmark throughput for all disks of Table 3,
two of the workloads of Table 2, the four
disk scheduling algorithms, ReiserFS, and disk queue depth of 1.
|
6.1 Disk Level Queuing
As we mentioned previously, disk request scheduling
is non-work conserving and the optimal algorithm, which is
also NP-complete, uses the positioning time rather
than the seek time per request, when it comes to compute the
optimal schedule [1].
Disk head positioning time is only accurately predicted at
the disk drive itself, rather than any other level of the
IO path.
This is because the SCSI interface does not support sharing
such information and because disks conduct various internal
background activities to enhance their performance and
reliability.
Consequently, predicting disk head position at the device
driver level is difficult, although, various efforts have
been made to enhance disk scheduling at the device driver
beyond the seek-based schedulers [5,16].
Computing the optimal schedule is computationally expensive
and impractical.
Consequently, newer disks with more CPU and memory resources
than before can easily accommodate long queue depths at the
disk level and exploit almost all the performance enhancement
available via disk level request reordering based on advanced
heuristics rather than the optimal scheduling.
The queuing buffer of the disks of Table 3 can
hold up to 64 outstanding requests and they implement variants
of the Shortest Positioning Time First algorithms [27].
The queue depth at the disk drive level is a parameter
set at the device driver and often set to 4 (the default
value for many SCSI device drivers).
The queue depth at the disk is commonly kept low to avoid request
starvation, because disk drive scheduling introduces variability
in request response time, which can be controlled easily by the
operating system at the device driver with algorithms such as
Deadline but not at the disk drive level.
Here, we set the disk queue depth beyond the default 4 to
evaluate the overall system benefits by queuing more at
the disk drive level.
To ease our presentation, we use only the 18 GB and the 300 GB
disks from Table 3.
The rest of the system configuration is: ReiserFS and the SS
workload from Table 2.
We use these settings because they represent the case with the
most efficient and pronounced optimization (among all cases
evaluated in the previous sections).
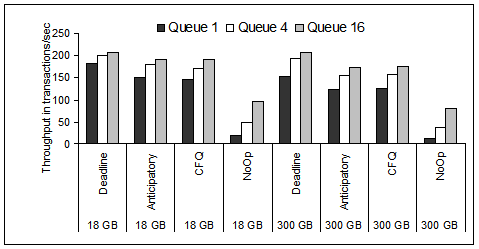
We plot the measured Postmark throughput in
Figure 15.
The plot shows that, although the disk is the lowest component
in the IO path, by only increasing the disk queue depth, we improve
overall application performance and throughput.
Figure 15:
Postmark throughput as a function of the disk queue depth
for the 18 GB and the 300 GB disks, ReiserFS, and the SS workload.
|
The relative gain of deeper queues at the disk in
Figure 15, is more pronounced
for the newer 300 GB disk than the older 18 GB one.
Actually for the best performing device driver scheduling
algorithm (i.e., Deadline), the throughput of the 300 GB disk
which we showed in Figures 14
and 13 to be lower than that of
the other disks for the same workload, is very close to
the throughput of the 18 GB disk.
6.2 Disks with Write Cache Enabled
The cache at the disk, as anywhere else in the system,
is an important resource that aids performance enhancement
in the IO path.
While evaluation of disk cache effectiveness is outside the
scope of our analysis, in this section, we evaluate the relation
between the effectiveness of disk level queuing and
two different policies for using the available cache by the
incoming write traffic, specifically, the ``write-back''
and the ``write-through'' polices.
The write-back policy is proposed to further enhance performance
at the disk drive level. Under the write-back policy, once a write
request has arrived at the disk cache, the host is notified for
its completion. From the host perspective the write service time
is equal to the disk cache hit time rather than the time to
actually completely store the write on the disk media.
The drawback of this policy is that it might lead to inconsistencies
during system crashes or failures, because the data is not permanently
stored while it appears so for the host system. Disk write-back policy
is the default one for all the SATA drives, which are installed
in systems with moderate reliability requirements.
Interestingly enough, even the newer SCSI Seagate disks
(i.e., the 146 GB and the 300 GB ones) came with the write cache enabled.
It is true that if non-volatile memory is available in the IO path,
then inconsistencies because of data loss during crashes are reduced.
As such ``write-back'' is the default policy for disk drives.
The other option is to write the data through on the disk and notify the
host that a write is completed only when the data is actually stored
safely on the disk media. This means that read and write traffic are
handled similarly and for almost all writes the disk service time is
not going to be the disk cache-hit time anymore. This policy is
called ``write-though'' and provides high levels of data reliability
and consistency. Disk level performance under the ``write-through''
policy is worse than under the ``write-back'' policy, which explains why
the former is used only in systems with the highest level of data
reliability and consistency requirements. All our previous results in
this paper are generated with ``write-through'' disk caches.
In this subsection, we evaluate the system and application behavior when the
only parameter that changes in our testbed is the disk queue depth
while we set the file system to be ReiserFS and run the SS workload.
We also set the disk cache to be ``write-back''. We conduct measurements
for all four device driver schedulers in our evaluation.
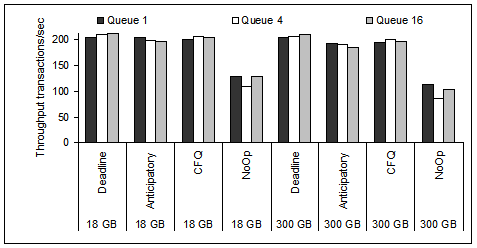
We present Postmark throughput in Figure 16.
Without disk-level queuing (i.e., queue depth of one)
Postmark achieves the highest (or very close to it) throughput possible
for the configuration. Additional queuing at the disk, commonly results
in performance degradation. In particular, this is the case when
the device driver scheduler, such as No-Op, is not effective on
IO request ordering and merging.
The adversary affect of disk level queuing on overall system performance
when ``write-back'' is enabled is related to the limited queueing
buffer space at the disk.
If write cache is enabled, the effective disk queue is longer than
what disk advertises at the device driver. Hence, under heavy loads,
as it is the case for Postmark, the actual disk queue reaches the
physical maximum allowable queue of 64 for the disks under our
evaluation. If the buffer queue at the disk is full,
the disk responds to the host with a ``disk full'' message, which
indicates that it can not accept more requests. Consequently,
the device driver delays the requests longer and because the IO subsystem
does operate as a closed system, these delays propagate and affect
overall system performance, i.e., the system slows down. As it can be seen
from Figure 16, the negative disk queuing effect
is not consistent. Specifically, the minimum throughput is often at queue
depth of 4 and not at the higher queue depth of 16.
Figure 16:
Postmark throughput as a function of the disk queue depth
for the 18 GB and 300 GB disks, ReiserFS and the ``small files,
small working set'' (SS) workload. Write-back cache is enabled at the disk.
|
Comparing results in Figure 15 with results
in Figure 16, we observe that if the disk
``write-through'' policy is enabled as well as the queue depth is set
to a high value, then highest Postmark throughput achieved under
``write-through'' and ``write-back'' policies are very close.
This means that the level of optimization offered in the IO
path, in particular disk level queuing, is as effective as to close
the performance gap between the disk ``write-through'' and
``write-back'' policies. We conclude this subsection, by stressing that
deep disk queues and ``write-through'' policy not only achieve
application-level throughput as high as under the performance-enhancer
``write-back'' policy, but enhance the always needed data consistency and
reliability.
6.3 Second application: Linux kernel build
As we discussed in more length in Subsection 5.1,
Postmark load is high and we choose to benchmark also a case of medium
load in the system by compiling simultaneously two and four Linux
kernels. Under high load, as it is the case of Postmark, IO requests
wait mostly at the device driver, because the number of outstanding IO
requests is higher than the maximum disk queue depth. Hence disk level
queuing is effective only for a small portion of the outstanding IO
requests and optimization effectiveness at the device driver becomes
more important than queuing at the disk drive level.
Under medium loads, as it is the case of the Linux kernel compilation,
which we described in Subsection 5.1, the impact
of disk queuing in the overall system performance is higher than under
high loads.
This holds in particular for cases when the optimization at the device
driver level (or any other level in the IO path) is not as effective as
it could be (as it is the case of the No-Op scheduler).
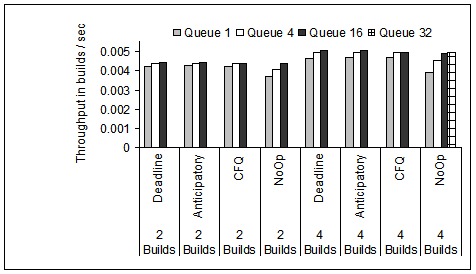
In Figure 17, we show the effectiveness of
disk queuing when compiling 2 and 4 Linux kernels simultaneously.
Note that No-Op benefits the most from disk queuing and the result
is that the overall system performance (measured in builds per seconds)
is very close for all four device driver disk schedulers when disk queue
depth is 16 or higher. Hence,
we conclude that disk level queuing and scheduling is effective
and does close any performance gaps in the IO request reordering
from the higher levels in the IO path.
Figure 17:
Throughput in builds per second for the four disk scheduling
algorithms, and different disk queue depths. Measurements are
done on the 18 GB disk and ReiserFS.
|
7 Related Work
Because the performance gap between memory and disk drives has remained
significant, even with the latest advances in technology, optimizing
performance in the IO path has been the focus of work for many
researchers. In addition to adding resources such as caches
[2] in the IO path and managing them more
efficiently [14],
optimization of the IO activity itself is one of the main
tools to enhance IO performance. IO workload optimization
consists mostly of request merging and request reordering
at various levels of the IO hierarchy, such as
the file system, the device driver, and the disk drive.
IO work reordering via scheduling early on aimed at minimizing
the linear disk head movement
(i.e., seeks) [3,4,7,20] and
later evolved to minimizing the overall head position
phase [1,10,21]
of a disk request service.
Because IO request reordering introduces variability in request
response time, multiple variations are proposed to mitigate
the problem [27].
On the analytic side, there are studies that compare analytically
disk scheduling algorithms [25] and derive
empirical models of disk access patterns to facilitate
such comparison [26].
Recent advances in disk scheduling include speculative waiting to
better exploit temporal and spatial locality of IO
requests [9], predicting disk service times
[16] and disk head position [5]
to enhance performance of seek-based schedulers at the device driver,
increasing disk head utilization by reading ``for free'' data on the path of
the disk head movement [13], and other
hierarchical approaches [22], which are mostly used
for performance virtualization in large systems [12].
Performance optimization at the disk drive level is mostly
related to request scheduling and evaluated in association with
it [27]. IO performance improvement is also evaluated
in association with workload characterization studies [19].
Performance enhancement related to advancements in disk technology,
including areal density and rotational speed
is discussed in [15]..
While most request reordering happens either at the device driver
or at the disk, file systems also represent a critical
component of the IO path capable of effective IO work optimization.
The main research efforts when it comes to enhancing file systems,
are related with improving data reliability and consistency
[17,23]. However considerable
work is done to enhance file system performance as well. For example
scalability of the XFS file system is discussed in [24]
and file system workload characteristics are analyzed in [6,8].
A comparative study between file systems is presented in [18].
Apart from the existing work, our paper analyzes advances in the IO path,
and evaluates how effectively they integrally
optimize and enhance IO performance. Most works
evaluate the components of the IO path individually, while in this
paper, we analyze their impact in overall application performance.
Our goal is to first identify the reasons why some components in
the IO path are more effective than others in optimizing the IO workload
and secondly understand if and how such optimization can be as effective
in other tiers as well with the goal to further enhance IO subsystem
performance.
8 Conclusions
In this paper, we presented a measurement-based analysis of the optimization
effectiveness in the IO subsystem,
focusing on the file system, device driver scheduler, and the disk itself.
We used the Postmark benchmark to generate heavy IO write-intensive workload
and the Linux kernel compilation to generate medium IO write-intensive
workload.
We analyzed four file systems, four device driver level disk schedulers
and three Seagate disk drives.
Our measurements showed that request merging is critical for reducing the
number of disk requests and enhancing overall performance.
Although, request merging takes place at the device driver scheduler,
it is the block allocation and data management at the file system itself
that determines the effectiveness of the request merging process.
The most effective file system in our measurements was ReiserFS which
improved by as high as 100% application-level throughput.
Under medium load though, request merging becomes less efficient and request
reordering becomes the tool to optimize the IO traffic.
Request reordering at the device driver level improved application-level
throughput by as much as 20% application-level throughput under the
Deadline device driver scheduler.
Disk drives have become very effective on optimizing request reordering,
closing any performance gaps between the elevator-based and FCFS device
driver schedulers.
Increasing the queue depth at the disk drive under the write-through
cache policy, improves the overall application throughput with as much as
30% if the device driver scheduler is seek-based and more than 6 times
if the device driver scheduler is FCFS (No-Op).
On the contrary, under heavy load, disk queuing has a negative impact
on application throughput when the write-back cache policy is enabled.
Overall, combining the write-through disk cache policy and high queue
depths performs similarly with the write-back disk cache policy and it is
attractive because it does not compromise data reliability and consistency,
as the write-back cache policy does.
- 1
-
ANDREWS, M., BENDER, M. A., AND ZHANG, L.
New algorithms for the disk scheduling problem.
Algorithmica 32, 2 (2002), 277-301.
- 2
-
BAKER, M., ASAMI, S., DEPRIT, E., OUSTERHOUT, J. K., AND SELTZER, M. I.
Non-volatile memory for fast, reliable file systems.
In ASPLOS (1992), pp. 10-22.
- 3
-
COFFMAN, E. G., AND HOFRI, M.
On the expected performance of scanning disks.
SIAM Journal of Computing 10, 1 (1982), 60-70.
- 4
-
DENNING, P. J.
Effects of scheduling on file memory operations.
In Proceedings of AFIPS Spring Joint Computer Conference
(1967), pp. 9-21.
- 5
-
DIMITRIJEVIC, Z., RANGASWAMI, R., AND CHANG, E. Y.
Systems support for preemptive disk scheduling.
IEEE Trans. Computers 54, 10 (2005), 1314-1326.
- 6
-
ELLARD, D., LEDLIE, J., MALKANI, P., AND SELTZER, M.
Passive nfs tracing of email and research workloads.
In FAST '03: Proceedings of the 2nd USENIX Conference on File
and Storage Technologies (Berkeley, CA, USA, 2003), USENIX Association,
pp. 203-216.
- 7
-
GEIST, R., AND DANIEL, S.
A continuum of disk scheduling algorithms.
ACM transactions on Computer systems 5, 1 (1987), 77-92.
- 8
-
GRIBBLE, S. D., MANKU, G. S., ROSELLI, D., BREWER, E. A., GIBSON, T. J.,
AND MILLER, E. L.
Self-similarity in file systems.
In SIGMETRICS '98/PERFORMANCE '98: Proceedings of the 1998 ACM
SIGMETRICS joint international conference on Measurement and modeling of
computer systems (1998), ACM Press, pp. 141-150.
- 9
-
IYER, S., AND DRUSCHEL, P.
Anticipatory scheduling: A disk scheduling framework to overcome
deceptive idleness in synchronous I/O.
In 18th ACM Symposium on Operating Systems Principles (Oct.
2001).
- 10
-
JACOBSON, D. M., AND WILKES, J.
Disk scheduling algorithms based on rotational position.
Tech. Rep. HPL-CSP-91-7rev1, HP Laboratories, 1991.
- 11
-
KATCHER, J.
Postmark: A new file system benchmark.
Tech. Rep. 3022, Network Appliances, Oct. 1997.
- 12
-
LUMB, C. R., MERCHANT, A., AND ALVAREZ, G. A.
Façade: Virtual storage devices with performance guarantees.
In FAST (2003).
- 13
-
LUMB, C. R., SCHINDLER, J., GANGER, G. R., NAGLE, D., AND RIEDEL, E.
Towards higher disk head utilization: Extracting "free" bandwidth
from busy disk drives.
In OSDI (2000), pp. 87-102.
- 14
-
MEGIDDO, N., AND MODHA, D. S.
Arc: A self-tuning, low overhead replacement cache.
In FAST (2003).
- 15
-
NG, S. W.
Advances in disk technology: Performance issues.
IEEE Computer 31, 5 (1998), 75-81.
- 16
-
POPOVICI, F. I., ARPACI-DUSSEAU, A. C., AND ARPACI-DUSSEAU, R. H.
Robust, portable i/o scheduling with the disk mimic.
In Proceedings of Annual USENIX Technical Conference (San
Antonio, TX, June 2003), pp. 311-324.
- 17
-
PRABHAKARAN, V., ARPACI-DUSSEAU, A. C., AND ARPACI-DUSSEAU, R. H.
Analysis and evolution of journaling file systems.
In USENIX Annual Technical Conference, General Track (2005),
pp. 105-120.
- 18
-
ROSELLI, D., LORCH, J. R., AND E.ANDERSON, T.
A comparison of file systems workloads.
In Proceedings of USENIX Technical Annual Conference (2000),
pp. 41-54.
- 19
-
RUEMMLER, C., AND WILKES, J.
Unix disk access patterns.
In Proceedings of the Winter 1993 USENIX Technical
Conference (1993), pp. 313-323.
- 20
-
SEAMAN, P. H., LIND, R. A., AND WILSON, T. L.
An analysis of auxilary-storage activity.
IBM System Journal 5, 3 (1966), 158-170.
- 21
-
SELTZER, M., CHEN, P., AND OSTERHOUT, J.
Disk scheduling revisited.
In Proceedings of the Winter 1990 USENIX Technical
Conference (Washington, DC, 1990), pp. 313-323.
- 22
-
SHENOY, P., AND VIN, H. M.
Cello: A disk scheduling framework for next generation operating
systems.
In Proceedings of ACM SIGMETRICS Conference, Madison, WI
(June 1998), pp. 44-55.
- 23
-
STEIN, C. A., HOWARD, J. H., AND SELTZER, M. I.
Unifying file system protection.
In Proceedings of the General Track: 2002 USENIX Annual
Technical Conference (Berkeley, CA, USA, 2001), USENIX Association,
pp. 79-90.
- 24
-
SWEENEY, A., DOUCETTE, D., HU, W., ANDERSON, C., NISHIMOTO, M., AND PECK,
G.
Scalability in the XFS file system.
In Proceedings of the USENIX 1996 Technical Conference (San
Diego, CA, USA, 22-26 1996), pp. 1-14.
- 25
-
TEOREY, T. J., AND PINKERTON, T. B.
A comparative analysis of disk scheduling policies.
Commun. ACM 15, 3 (1972), 177-184.
- 26
-
WILHELM, N. C.
An anomaly in disk scheduling: a comparison of fcfs and sstf seek
scheduling using an empirical model for disk accesses.
Commun. ACM 19, 1 (1976), 13-17.
- 27
-
WORTHINGTON, B. L., GANGER, G. R., AND PATT, Y. N.
Scheduling algorithms for modern disk drives.
SIGMETRICS Perform. Eval. Rev. 22, 1 (1994), 241-251.
Evaluating Block-level Optimization through the IO Path
This document was generated using the
LaTeX2HTML translator Version 2002-2-1 (1.71)
Copyright © 1993, 1994, 1995, 1996,
Nikos Drakos,
Computer Based Learning Unit, University of Leeds.
Copyright © 1997, 1998, 1999,
Ross Moore,
Mathematics Department, Macquarie University, Sydney.
The command line arguments were:
latex2html -split 0 -show_section_numbers -local_icons main.tex
The translation was initiated by Alma Riska on 2007-04-25
Alma Riska
2007-04-25
|