|
| |||||||||||||||||||||||||||||||||||||||||||||||||||

| ||||||||||||||||||||||||||||||||||||||||||||||||||||
|
LISA '03 Paper
[LISA '03 Technical Program]
New NFS Tracing Tools and Techniques for System AnalysisAbstractPassive NFS traces provide an easy and unobtrusive way to measure, analyze, and gain an understanding of an NFS workload. Historically, such traces have been used primarily by file system researchers in an attempt to understand, categorize, and generalize file system workloads. However, because such traces provide a wealth of detailed information about how a specific system is actually used, they should also be of interest to system administrators. We introduce a new open- source toolkit for passively gathering and summarizing NFS traces and show how to use this toolkit to perform analyses that are difficult or impossible with existing tools. IntroductionThe purpose of most passive NFS tracing research tools is to discover and investigate workload characteristics that can be exploited by the operating system. The goals of the tools and methods described in this paper are quite different - we wish to use passive NFS trace analysis to help system administrators understand the workload on their systems, identify latent performance issues, and diagnose specific problems. For example, file system researchers might be content to know that on a particular system most of the reads come from a small number of large files, but the administrators of that system might also want to know the names of those files. If the system becomes swamped with requests for those files, the administrators might also want to identify the owner of the files and the users responsible for the requests so that those users can be consulted. There already exist a number of tools that make it possible to quantify many aspects of NFS traffic, and system administrators have devised ways to use these tools in order to identify and debug common problems [17]. Unfortunately, most of these techniques are limited in their ability to analyze the activities of specific clients and users. Furthermore, they are tailored to solving specific problems and are difficult to use as a way to explore the wealth of information that can be gleaned from NFS traces. In this paper, we describe nfsdump and nfsscan, a pair of tools that provide a framework for gathering and analyzing NFS traces in a general and extensible manner. nfsdump collects NFS traces, while nfsscan scans through the traces gathered by nfsdump and creates a set of summary tables that can be analyzed by simple scripts or imported into a spreadsheet or other data analysis tool for further processing. In addition to nfsdump and nfsscan, we describe ns_timeagg, ns_split, and ns_quickview, three applications that simplify manipulation of the tables created by nfsscan. The advantage of decoupling the process of gathering traces from trace analysis is that the same traces can be analyzed several ways and at different time scales. It also means that there is a clear interface between these tools and that they can be used independently. For example, we have written several other programs to analyze the output of nfsdump and used them in our own studies of NFS workloads and usage patterns [6, 7]. Another advantage of the separation of the gathering and analysis of traces is that the data may be anonymized before analysis. The nfsdump toolkit includes an anonymizing postprocessor that anonymizes the client and server IP addresses, user and group ID numbers, and file names. All of the data presented in this paper have been anonymized so that they may be made public. In ordinary use by system administrators, however, this anonymization step would be omitted so that specific and potentially useful identifying information about users, groups, client hosts, and file names is preserved. The rest of this paper is organized as follows:
Related WorkNFS[Note 1] trace analysis has a long and rich history as a tool for file system research. Because of this, most of the work in passive NFS trace analysis has focused on research topics such as characterizing workloads and investigating the effects of client-side caching [5, 15]. Matthew Blaze introduced several techniques for inferring the client workload from an NFS trace and implemented these techniques in rpcspy and nfstrace [1]. Andrew Moore gives a survey of these and other techniques and contrasts the analysis of file system workloads via passive network monitoring and direct kernel-level traces [12]. This work shows that passive NFS tracing reveals useful and accurate information about many aspects of an NFS workload. There already exist many tools for gathering NFS traces or summary information about NFS activity. Basic tools like nfsstat(1M), iostat(1M), and nfswatch [4] provide aggregate statistics about NFS traffic. For many diagnostic purposes, these statistics suffice. Specialized tools such as nfstrace and the NFS Logging System [18] focus entirely on NFS. General-purpose network protocol monitors, such as tcpdump [11], ethereal [3], rpcspy [1], and snoop [19] can be used to analyze NFS traffic and other system activity. Most of these tools contain code to decode and print detailed information about NFS calls and responses, and therefore general-purpose tools like (.*?) have replaced special-purpose NFS monitors in many contexts. In terms of general capability, our system most closely resembles nfswatch and the NFS logging/nfslogd system provided with Solaris. In comparison to nfswatch, nfsdump/nfsscan is more flexible because it runs on more platforms and captures more information - nfsscan can gather any combination of per-user, per-group, per-client, per-file, and per-directory information, while nfswatch gathers either per-user or per-client information. In contrast to the NFS logging system and nfslogd, our system is completely passive, can run on a separate host instead of running on the server, and is portable across a range of platforms instead of being tied to Solaris. A shortcoming of nfsdump/nfsscan is that it does not attempt to reconstruct an application-level trace of the NFS activity in the same manner as nfslogd, but this capability could be added as a postprocess to the output of nfsdump (much as nfslogd postprocesses the records created by the NFS Logging System). The ToolkitOur toolkit consists primarily of a pair of tools, nfsdump and nfsscan. nfsdump collects NFS traces, while nfsscan takes those traces and generates summary tables useful for further analyses. In addition, we bundle three analysis applications in our toolkit - ns_timeagg, ns_split, and ns_quickview - which postprocess the nfsscan summary tables. nfsdumpOur tracing system, nfsdump, is similar to nfstrace or tcpdump in general philosophy, but captures more information than either, and, unlike tcpdump, only decodes the NFS protocol. Like tcpdump, the output of nfsdump is human-readable text. nfsdump uses libpcap [10], the same packet-capture library as tcpdump, and has the ability to read and write raw packet files in the same format as tcpdump or any other tool that uses this format. The most important functional differences between nfsdump and earlier tools are that nfsdump captures the effective UID and GID of each call, and properly decodes RPC over TCP (even with jumbo frames). nfsscanThe first step of our analysis system, nfsscan, writes its data in a format designed to be easy to parse and interface with other tools. This is in contrast with most other tracing tools, which often generate output in an irregular, difficult to parse, or undocumented format - for example, tcpdump 3.7.2 prints file offsets for read and write operations in hexadecimal for NFSv3 requests and decimal for NFSv2 requests, but does not print whether the request is NFSv2 or NFSv3. The output of nfsscan consists of one or more distinct tables (depending on how nfsscan is invoked). These tables can be analyzed by simple scripts or imported into a spreadsheet, database, or other data analysis tool for further processing. These tables include the following information:
By default, nfsscan only records the counts for the NFS operations that appear most frequently in a typical workload - read, write, lookup, getattr, access, create, and remove. Additional operations or an alternative list of operations may be specified on the command line. Unless more information is requested, nfsscan creates per-server aggregate statistics in a manner similar to nfsstat. However, it can also subdivide the statistics by any combination of client, UID, GID, and file handle, and it can filter the data based on caller host, UID, or GID. Helper ApplicationsThe most general and powerful method for analyzing the tables created by nfsscan is to import these tables into a database or data analysis package. To simplify some of the more common analyses, however, our toolkit includes several helper applications that make it possible to manipulate the output of nfsscan and perform useful analyses from the commandline or by using short shell scripts. By default, nfsscan creates a single table containing aggregate operation counts for each five-minute interval of a trace. The user may specify a shorter or longer time interval, but this is usually unnecessary. A helper application named ns_timeagg makes it easy to compute aggregates across rows of the table created by nfsscan. For example, if the nfsscan time interval is five minutes, ns_timeagg can create a new table with a time interval of one hour directly from the output of nfsscan. It is typically several orders of magnitude faster to compute aggregates from the tables generated by nfsscan than it is to re-run nfsscan with different parameters. ns_timeagg can also aggregate by client host, UID, or GID. In contrast to ns_timeagg, which combines rows from the table, ns_split provides a way to filter rows from the table, throwing away rows that do not match given criteria. A combination of ns_timeagg and ns_split is usually sufficient to isolate the interesting data. It is also easy to write scripts to manipulate the output of nfsscan, ns_timeagg, and ns_split because the tables are generated in a simple text format. The helper application ns_quickview uses (.*?) [20] to create plots for the operation count tables created by nfsscan, ns_timeagg, or ns_split. ns_quickview can either save the (.*?) script to file, so that it can be edited before execution, or generate the plots immediately. ns_quickview also accepts commands to pass directly to (.*?), which allows the user to customize the plots without editing the scripts. All of the plots in this paper were created by ns_quickview, using command-line options to tell (.*?) to create encapsulated postscript of the proper size and with the appropriate font. We anticipate that for most purposes, nfsscan with the default parameters will provide enough information to identify general trends in the data. If the user discovers that a specific period of the trace is particularly interesting, he or she can re-run nfsscan with different parameters to extract additional per-client, per-user, per- group, per-file, or per-directory information, as described in the Case Studies section, to build a table to investigate specific questions. It is possible to simply create the full set of tables containing all of the information for the entire trace, but this requires a large amount of processing time and memory, and the resulting tables require a considerable amount of disk space. Overview of the Example SystemsIn this section we describe the computing environments from which we collected the traces that are used in later sections to illustrate the use of nfsdump, nfsscan, and the helper applications. EECS03The EECS03 traces were taken from the Network Appliances Filer that serves the home directories for most of the Computer Science Department at Harvard University from February 17, 2003 through February 21, 2003. EECS03 has two network ports, serving clients on different subnets. Our traces are gathered from one of these ports. The EECS03 traces do not include backup activity. There is no standard EECS03 client machine, but a typical client is a workstation with at least 128 MB of RAM running GNU/Linux, UNIX, or Windows NT. The Windows machines access EECS03 via SAMBA running on a UNIX server, and therefore all of their network disk accesses appear in some form in the NFS trace. All workstations store their operating system and most of their applications on their local disk, and use their local disk for scratch space. EECS03 is used primarily for home directories and shared data. Email for EECS03 users is delivered on a separate file system. Some users use (.*?) or other preprocessors that file their mail for them in their home directory, and this activity is reflected in our traces, but on the whole email appears to play only a small role in the EECS03 workload. The EECS03 traces were taken from the same server as the EECS traces described in earlier work [6], but were taken more than a year later. Due in part to a redistribution of responsibilities among the servers of the EECS community, the workload of this server has changed significantly during this time. The largest difference is that the WWW server now uses EECS03 to store the main web pages; in EECS there was very little WWW traffic because most of the pages were stored on a separate file system. This raises the question of what the EECS03 workload would look like if we moved the WWW pages back to a separate file system. We will see how to investigate questions of this kind in the section "Exploring the Impact of the WWW Server on EECS03." DEAS03The DEAS03 traces were taken from the Network Appliances Filer that serves the home directories for the Division of Engineering and Applied Sciences at Harvard University from February 17, 2003 through February 21, 2003. The DEAS03 traces do not include backup activity. There is no standard DEAS03 client machine, but the typical DEAS03 client is a PC running GNU/Linux or Sparcstation running Solaris. In contrast to EECS03, the DEAS03 workload does contain email. Email for DEAS03 users is delivered to a mail spool outside of the users home directory, but on the same NFS file system. In addition to email, the DEAS03 workload contains a fairly typical research and development workload. The DEAS03 traces were taken from the same server as the DEAS traces described in earlier work [7], but in this paper we use a more recent trace. ICE and MAILICE and MAIL are traces from two different interfaces of the same Digital UNIX NFS server. This machine, along with several similarly configured machines, hosts the home directories of the general-purpose accounts provided to all undergraduates, graduate students, and University staff. Each of these machines hosts several file systems and has several network interfaces, and each network interface communicates with a different set of clients. Backup activity is not included in either the ICE or MAIL traces, because a separate interface is used for backups. The ICE trace captures the traffic from April 21, 2003 to April 25, 2003, between the NFS server and a set of machines that form the instructional computing environment, a shared resource used for computer science instruction and other academically-oriented work. Students are permitted to run email clients on the ICE machines. In this paper, we only analyze a trace of the traffic between one ICE host and one of the NFS home directory file systems.
The MAIL trace captures the traffic between the NFS server and the campus mail servers from May 5, 2003 to May 9, 2003. These machines host the IMAP and SMTP servers that handle the bulk of the campus email. Many users also login to these machines to run email programs, primarily pine. In this paper, we only analyze a trace of the traffic between one of the mail server hosts and one of the NFS home directory file systems. The MAIL traces are taken from the same general environment as the CAMPUS traces from 2001 described in earlier work [6]. However, during the elapsed time the system architecture has changed significantly - the mail software has been changed, and nearly all of the client hosts have been replaced with new hardware running a different operating system. As a result, the MAIL workload is quite different from the CAMPUS workload. Example AnalysesIn this section, we provide examples of some of the analyses that are easy to perform with nfsdump/ nfsscan, using five-day traces gathered from EECS03, DEAS03, ICE, and MAIL. Each of the traces begins at midnight on a Monday and continues until the end of the subsequent Friday. The traces have been processed with nfsscan, including per- client and per-user information in addition to the default information. We will assume that the output from nfsscan for each trace has been saved in files EECS03.ns, DEAS03.ns, ICE.ns, and MAIL.ns. For some of the examples, we will also assume that each of the .ns files has also been split into five files corresponding to the days of the trace, and given names like EECS03-1.ns. What are the General Workload Characteristics?The most general question of interest is how many operations of each type a server performs over a given period of time. We can use ns_timeagg to compute summary statistics for an entire table created by nfsscan by specifying a time interval of zero. Table 1 shows the total operation counts for five consecutive weekdays, and the percentage of the total contributed by each of the most common operations. Figure 1 shows the commands that generated the counts shown in Table 1. ns_timeagg -t 0 EECS03.ns ns_timeagg -t 0 DEAS03.ns ns_timeagg -t 0 ICE.ns ns_timeagg -t 0 MAIL.ns Table 1 illustrates the diversity of workloads that NFS servers must support:
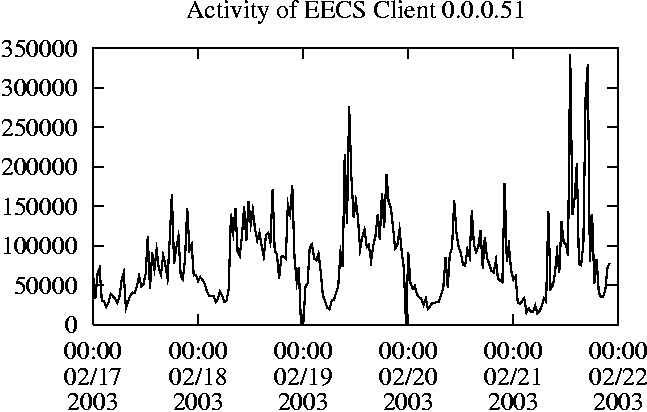
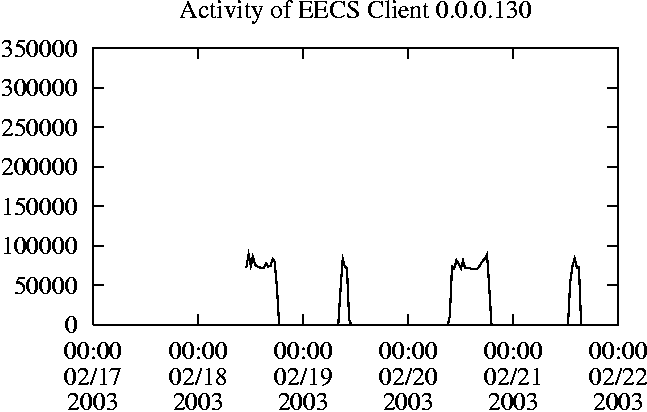
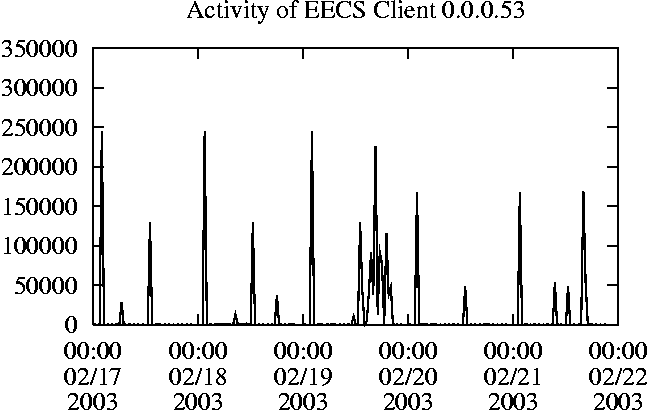
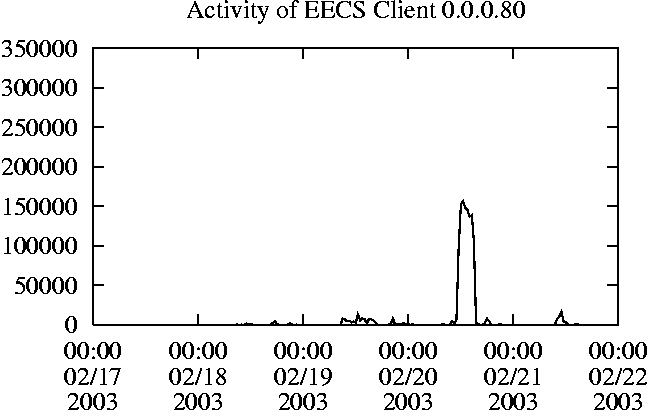
When is the System Most and Least Busy?In order to plan maintenance activity or schedule large jobs in such a way to make the best use of an NFS server, it is important to know when the system is busy and whether there are idle periods. In our own research we have found that on many systems the load varies in a highly predictable manner according to the time of day and day of week. However, these patterns are not always intuitive - on one system, we found that the system was swamped with requests between 4:00 am and 9:00 am because several users thought that this would be the time when the system would be most idle, and therefore they each scheduled their largest jobs to run at this time. We can use ns_timeagg to aggregate the data by client, and then use ns_quickview to create plots of the data. Note that for a quick look at the basic load patterns, a five-minute interval is too short. To change the interval, use the (.*?) flag, which takes a parameter measured in seconds. An example of a command to create a quick plot of the total operation count of EECS03 for each 30-minute interval during the trace period is shown in Figure 2. ns_timeagg -t 1800 EECS03.ns > EECS03.tmp ns_quickview EECS03.tmp ns_timeagg -t 1800 EECS03-1.ns > EECS03-1.tmp ... ns_timeagg -t 1800 EECS03-5.ns > EECS03-5.tmp ns_quickview -l EECS03-[12345].tmp Figure 4 shows examples of plots created by ns_quickview. The left column of this figure shows plots of the total operation count for each host for each half hour period over five consecutive weekdays. The right column shows the same data, but with the data for each day plotted on top of each other. The plot from the commands in Figure 2 is shown in the top left of Figure 4. To see if the workload repeats strongly from one day to the next, we can take each day of the five day period and use ns_quickview to overlay the data on the same hourly scale. The command for accomplishing this is shown in Figure 3, and the resulting plot is shown in the top right of Figure 4. We repeat this pair of plots for the remaining systems (MAIL, ICE, and DEAS03). Daily cycles, if any, will be readily apparent. 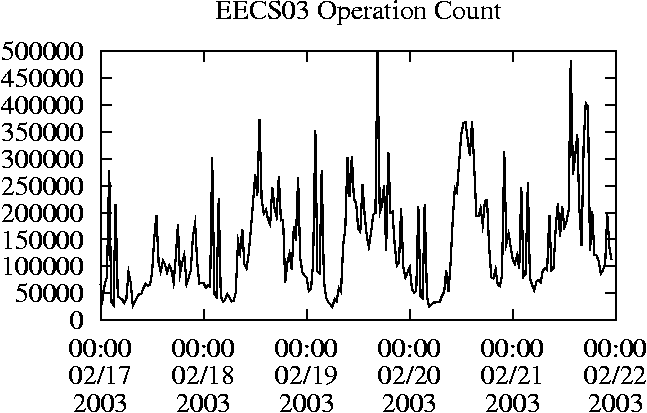 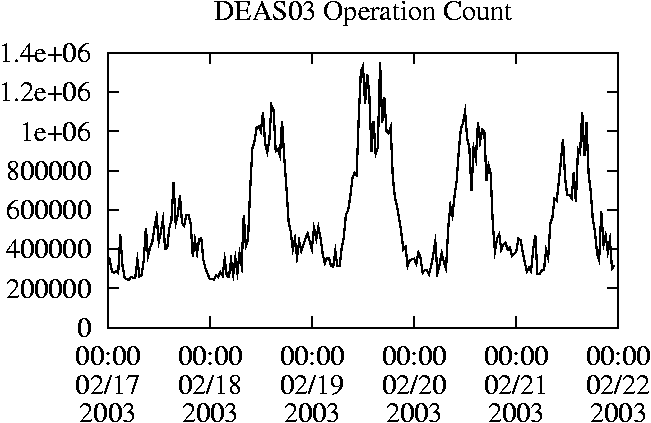 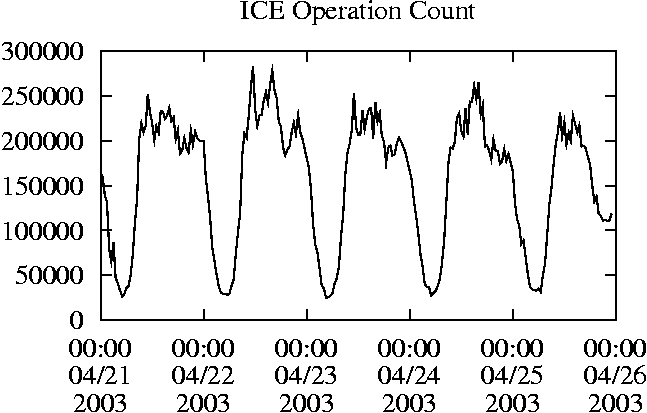 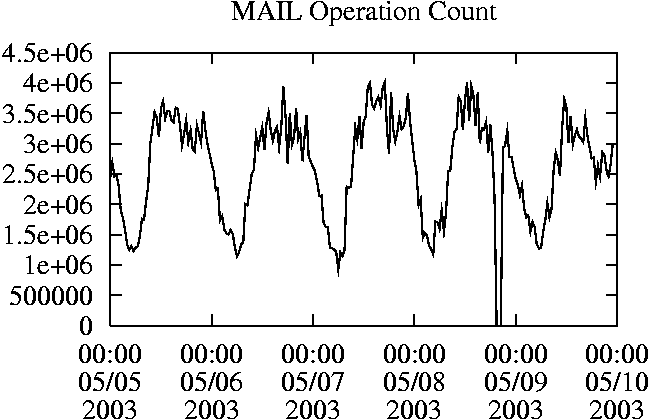 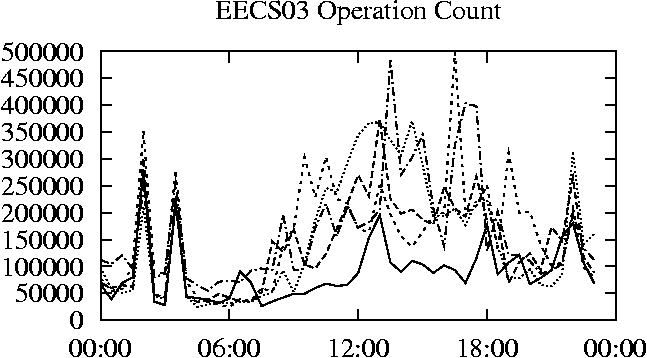 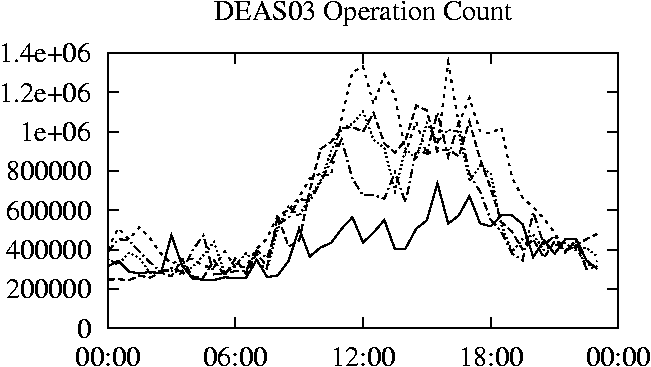 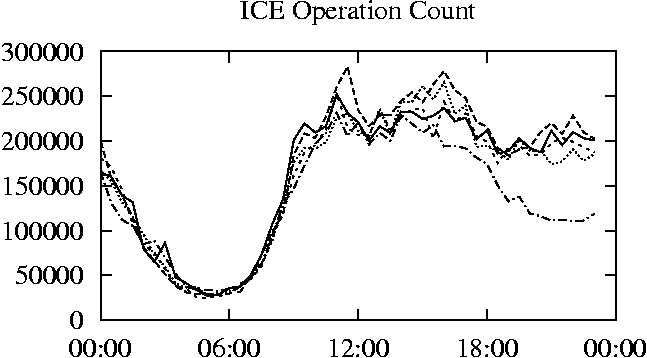 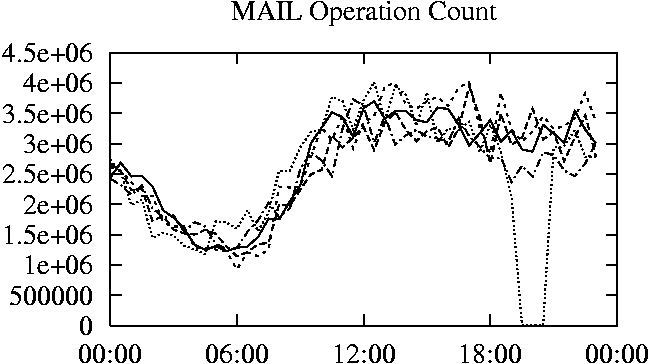 MAIL, ICE and DEAS03 have clear daily rhythms. For all three systems, the operation rate is low in the late evening and early morning, and then climbs rapidly though the morning, reaching a peak at approximately noon, and then staying high throughout the afternoon. The operation rate for DEAS03 decreases rapidly at the end of business hours, but ICE and MAIL are still busy until midnight. Both systems have predictable periods of relatively light activity. In the plot for the entire week for EECS03, it is hard to see any particular patterns, but the overlay plot shows that in addition to a general increase of activity during business hours, there are at least three regular daily events that cause load spikes twice in the early morning, and once in the late evening. The regularity of these events suggests that they are probably (.*?) jobs. The overlay plot for ICE shows that the workload is remarkably consistent from one day to the next, particularly in the early morning hours. We also note that the workload is lower than average for the weekdays on Friday afternoon and evening. (This is not apparent from the plots as they appear in this paper, because the key that shows which line corresponds to each day has been omitted from these plots. If requested, ns_quickview will label each line.) Note that the first day of the traces for EECS03 and DEAS03 is a University holiday, and this appears to have an impact on both systems. Also note that there is a gap in the MAIL traces during the evening of Thursday 5/9/2003 due to a problem with the host that gathered the traces. ns_timeagg -t 0 -B C EECS03.ns | sort -k7 -n -r > EECS03.cli.tmp Which Clients Are Busiest?Another question is which clients contribute the largest load to the system over time. We can investigate this by using ns_timeagg to compute the per-client operation counts. Figure 5 shows a command that computes the cumulative per-client operation counts for the entire trace period, and then sorts the resulting table in descending order by total operation count to find the busiest clients. The ten busiest clients for EECS03 are listed in Table 2. Once we have identified the busiest clients (or any other clients that we think are interesting) we can use ns_split to extract the contribution from those clients, use ns_timeagg to create a table of the activity of those clients over time, and then use ns_quickview to create plots from these tables, using a command like the one shown in Figure 6. ns_split -B C -c 0.0.0.51 EECS.ns | \ ns_timeagg -B C -t 1800 > EECS03.tmp ns_quickview EECS03.tmp Figure 7 shows plots generated via ns_quickview for the four
busiest systems.
    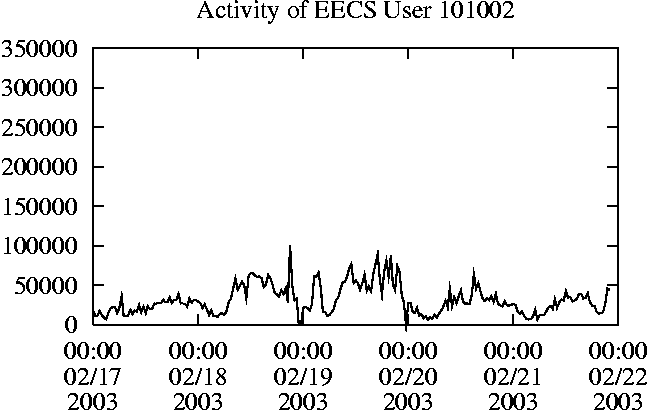 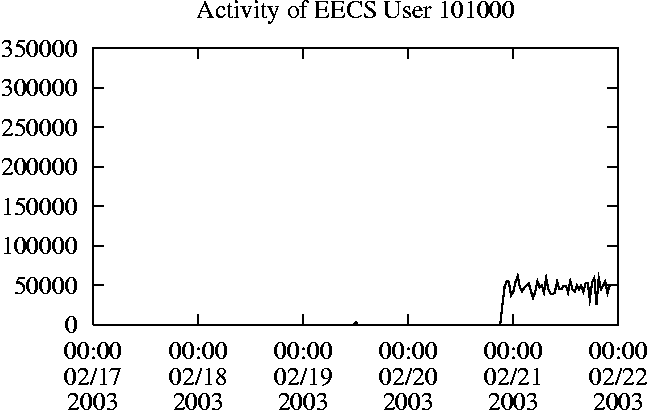 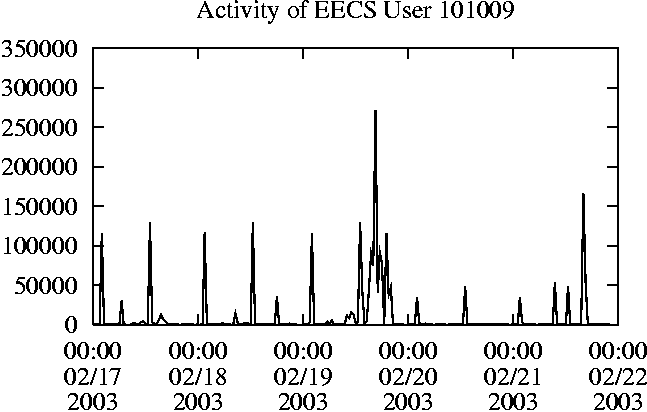 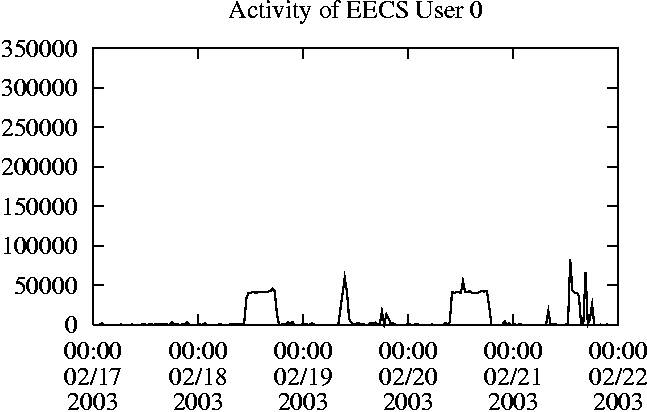 Which Users Are Busiest?Finding the busiest users is done in the same manner as finding the busiest clients. The only difference is that the aggregation is per user, instead of per client. A table of the operation counts for the ten busiest users on EECS03 for the five days 2/17/2003 through 2/21/2003 is shown in Table 3. Once again, there is great diversity of workload patterns illustrated in this simple table.
What Files are Busiest?We can also use nfsscan to discover which files and directories are the object of the most operations, and what those operations are. This can be useful to identify hot files or directories, which might benefit from being replicated (if read-only), moved to a local disk (if not shared), or moved to a faster file server. nfsscan can compute per-file operation counts in the same manner as it can create per-user and per-client operation counts. It can also gather additional descriptive information about files, such as their pathname, owner, permissions, and modification times. To save space, particularly when per-user or per-client information is gathered in addition to per-file information, the file description information is stored in a separate table. Both tables can be indexed by file handle, however, so they can be joined if necessary. Which Directories are Busiest?nfsscan can also compute per-directory operation counts. The directory operation count is defined as the sum of the operation counts for all of the files and subdirectories of the directory. This metric is useful for identifying collections of files or directory hierarchies that are the object of many operations even if each individual file is not the object of many. For example, some mail clients store each email message as a separate file in a directory dedicated to this purpose, while others store an entire mailbox (or even a collection of mailboxes) as a single file. In the latter case, it is straightforward to identify and count all of the operations associated with the email of a particular user by keeping track of all operations associated with a single file. In the former case, however, it is much more difficult because the activity is distributed over a directory of files. In this situation, per-directory operation counts are a useful way to aggregate all of this activity into a single table row. Another example where per-directory operation counts can be helpful is for measuring the total usage of shared directories, such as source code repositories. Per-directory operation counts can also help identify the busiest subdirectories of a web site. Although it might seem that much of this information can be inferred from the web server logs (which record details about what requests web clients make, and how much data the web server sends to its clients), this may lead to inaccurate conclusions. It may be that there are important differences between the traffic from a web server and its clients and the traffic from the web server and the NFS server. For example, if most requests to the web site are for the same pages, these pages may be cached in the web server and therefore these requests will not translate into much NFS activity. As another example, typical web server logs contain no useful information about what files are accessed each time a dynamically generated web page is visited. The total amount of data used to generate such a page might be very different from the amount of data that the web server finally sends to the client. Case StudiesPreviously, we showed how to use nfsscan, ns_timeagg, ns_split, and ns_quickview to perform several basic analyses. In this section, we show how to perform deeper analyses by exploring several interesting aspects of the traces. What is Root Doing on EECS03?As we saw in Table 3, root was one of the busiest users on EECS03 during the trace period. This is surprising because the EECS03 server is configured to treat root as an untrusted user except from a small number of machines. It is also interesting that nearly all of the NFS operations performed by root during this period are not operations that nfsscan ordinarily considers interesting, and therefore does not tabulate. To investigate this mystery, we first used ns_split to remove the "trusted" hosts from the table. This made little difference, however, which was a bit troubling because this appears to imply that at least one supposedly untrusted host was able to access the server as root. This, of course, is the kind of situation that haunts the nightmares of NFS system administrators, and so we immediately investigated further. The plots for the load from client 0.0.0.130 (in Figure 7) and the load for the root user (in Figure 8) provided a valuable clue. These two plots are very similar in shape (although not in magnitude), suggesting that the activity of this host and the activity of the root account are linked. A quick check using ns_split to isolate the contributions of the root user on client 0.0.0.130 confirmed that most of the operations performed by root during the trace period were indeed taking place on that system. Using ns_split again to isolate the activity of the user who owns client 0.0.0.130, we observe that at every time scale, plots of the total operation count for this user and for root have an almost identical shape. A further mystery was that the operations performed by the user mostly fell into the category of "normal" operations, unlike virtually all of the operations performed by root. Now that we knew exactly what host to check and what period of the trace to examine, we re-ran nfsscan on a short section of the EECS03 traces, asking it to collect operation counts for all the NFS operations instead of only the default set of "interesting" operations. We discovered that all of the mystery operations were (.*?) calls. Looking at the trace itself showed that for every operation invoked by the user, there was one or more corresponding (.*?) call. The (.*?) call requests information about a NFS file system, including how much free space there is, and whether there have been any changes to the underlying file system (such as might be caused by a reboot or remount). Because (.*?) does not access information about specific files or directories, it is permitted to run as root even if root is untrusted, and many NFS client implementations, including the one running on 0.0.0.130, are implemented to treat (.*?) calls as if they were being performed on behalf of root. The reason that 0.0.0.130 stands out is that the NFS client used by this host is implemented in a very conservative manner, and during the trace period was also misconfigured, and therefore used (.*?) incessantly, generating at least one (.*?) call per ordinary operation. The fact that the primary user of client 0.0.0.130 is also one of the busiest users in the trace makes this behavior stand out even more. Unfortunately for the purpose of our analysis, the user of host 0.0.0.130 noticed that the machine seemed sluggish and requested an upgrade of the OS before we had an opportunity to discover the cause of the excessive (.*?) calls. However, using our tools we were able to confirm that during later trace periods the number of (.*?) calls generated by host 0.0.0.130 did return to normal levels. The behavior exhibited by client 0.0.0.130 raises some administration issues. When confined to a single host, the "extra" (.*?) calls have no serious implications, but this behavior could become a problem if the EECS administrators had deployed this configuration of this NFS client implementation across the entire department. If all of the clients of a server exhibited this behavior, the number of NFS requests would nearly double. On a relatively unloaded server (such as EECS during the EECS03 trace period) this additional load might not cause a problem (or even be noticed), but on a more heavily loaded system, such as DEAS03, ICE, and especially MAIL, doubling the number of NFS requests could have an impact on the total system because the additional requests would increase the apparent latency and overall utilization of the network. Exploring the Impact of the WWW Server on EECS03We noted in the previous section that the busiest EECS03 user is the WWW server account, and that the busiest client hosts the department web server. We also noted that the EECS03 trace exhibits different load characteristics from an earlier EECS trace, and theorized that this might be due to the fact that the earlier trace did not contain accesses to the WWW site. With nfsscan, we can test this theory. Two of the defining characteristics of the EECS traces are a read/write ratio of less than 1, and that requests for metadata outnumber reads and writes significantly. Since the WWW server account is by far the busiest user, and is dominated by reads, a reasonable hypothesis is that the EECS03 workload would resemble the EECS workload if the WWW server traffic was removed. We can test this hypothesis by using ns_split to create a new table with all of the contributions from the WWW server account removed. Removing the WWW server account from the workload does not change the character of the workload very much. The new workload still has a read/write ratio that is much closer to that of EECS03 than EECS. However, we can also note that after the WWW server account is removed, the busiest remaining user (user 10100) also has a notably high read/write ratio. Furthermore, if we use ns_split to make a table consisting only of this single user, we can see that the load from this user is distributed over a handful of machines. From our knowledge of the role of each of these machines, and our familiarity with the activities of this user, we know that the workload we are seeing from this user is probably due to this user running several large analyses. While it is normal for users to run their analyses on these machines, it is arguable that this analysis might be unusual because it does not resemble things we have seen in other traces. We can use ns_split again on the original table to compute the operation counts with both the WWW server and this user removed. The resulting operation counts do resemble the counts from the EECS traces - the read/write ratio is approximately 1, and requests for metadata ((.*?), (.*?), and (.*?)) dominate requests to read and write data. Therefore, if we can successfully argue that the high operation counts for user 10100 during this period are unusual, then we can claim that the workload of EECS03 is similar to EECS with the addition of the workload contributed by WWW server. However, there is an additional wrinkle to the analysis. In the original EECS configuration, the department web pages were hosted on a separate file system, but user home pages and some project home pages were hosted on the EECS NFS server. Therefore, accesses to personal home pages were recorded in the EECS traces, but they had little effect on the total overall workload. Using the per-directory statistics generated by nfsscan, we can see that this is no longer true (at least for this trace period). During this trace, project and user home pages contribute the overwhelming portion of the web-oriented traffic. Therefore, we can conclude that moving the departmental home pages back to a separate server would have little impact on the EECS03 workload. Moving user and project home pages to another server, however, would significantly reduce the EECS03 workload. Why is MAIL So Busy?The MAIL workload is prodigious, and is almost entirely reads. What is the source of all of these reads? Using nfsscan with per-user and per-file information, we can quickly identify the busiest files in the system, and see that nearly all of the reads come from mailboxes. Examination of a short trace (2:00 pm-3:00 pm on 5/6/2003) with nfsscan shows activity to 1033 inboxes on the MAIL file system. Approximately 70 of the owners of these inboxes have chosen to forward their email to other accounts or use an email preprocessor to categorize their incoming email, and therefore have very small inboxes. For the rest of the users, the median inbox size is more than 7 MB, and the largest 10% are over 35 MB. To make matters worse, these files are apparently read and re-read repeatedly by the email clients. We believe that much of the problem is due to the particular properties of NFS client caching. NFS semantics permit the client to cache data read from a file, but provide only weak constraints on the consistency of cached data. The server does not know whether the client is caching data, and does not inform the client if the data is updated by another writer. Instead, the server relies upon each client to check periodically whether its cached data are up to date by asking the server whether the underlying file has changed. To make matters worse, the client can only ask whether the file has changed, and not individual blocks. This means that any change to a file (even rewriting a single byte with the same value) will either cause NFS to invalidate all cached data associated with that file, or permit an inconsistency between the state of the file on the server and the client. In order to prevent inconsistencies and scrambled mailboxes, the mail clients and email servers running on the MAIL client NFS hosts essentially disables client-side caching. Combined with frequent mailbox scans performed by the mail clients and the large size of the mailboxes, the system is doomed to a heavy workload of incessant reads. Therefore we believe that accessing flat-file mailboxes over NFS is simply not practical in an environment such as MAIL. Elprin & Parno [8] have shown that IMAP servers that store email in databases can be significantly more efficient than servers that store their email in flat files, and we believe that such systems will be widely deployed as mail workloads continue to grow. Active AnalysesOne of the most attractive properties of collecting traces via nfsdump (or most of the the other tracing tools) is that it is completely non-invasive and unobtrusive; it requires no changes to the client or server, nor does it place any additional load on the system. However, there are hard limits to what can be learned from passive tracing because we can only observe active files and directories - if a file or directory is never accessed, then no information about it will appear in the trace. We can augment passive techniques with a small amount of active probing to the workload in order to discover information that would otherwise remain hidden. There are two mechanisms by which NFS requests specify the file or directory to act upon. Requests such as (.*?) and (.*?) specify the file via a file handle, an opaque object provided by the server to uniquely identify a file. Requests such as (.*?) or (.*?), on the other hand, specify a file via its name and the file handle of its parent directory. It is often useful to have a complete mapping between file names and file handles, so that we can identify all the operations that touch a particular file or directory, whichever way the identity of the file or directory is specified. We can infer most of this map simply by observing the results of the operations that the clients use to traverse the file system. Unfortunately, there are three cases in which we will fail to discover the proper mappings for a particular file or directory:
Ideally, it would be nice to run full traversals constantly in order to maximize the file system information captured by each trace. For most systems, however, this is simply not practical, because a full traversal can place a significant load on the system and on large file systems may require hours to run. In contrast, a shallow traversal requires a small fraction of the time of a full traversal, and captures information about the hottest directories. ConclusionWe have presented nfsdump and nfsscan, a framework for gathering NFS traces and performing simple analyses and shown how to use these tools to perform various analyses of NFS activity, including investigating aspects of the workload of four production NFS servers. Status and AvailabilityThe source for nfsdump, nfsscan, and the related tools mentioned in this paper are available for download from https://www.eecs.harvard.edu/sos/software/. Acknowledgments This work would not have been possible without the contributions of many
people, especially Peg Schafer, Aaron Mandel, Chris Palmer, Lars Kellog-
Stedman, Scott McGrath, and Alan Sundell, who allowed me to gather traces from
NFS servers under their administration. Peg Schafer, Lois Bennet, and Alan
Sundell also provided suggestions for useful analyses. Our paper shepherd,
Mario Obejas, provided helpful comments and suggestions regarding the
structure and content of this paper. About the AuthorsDaniel Ellard is a graduate student at Harvard University, where he expects to complete his Ph.D. in Computer Science this year. His thesis research concerns self-tuning file systems that automatically learn heuristics for choosing appropriate layout and replication policies for new files based on the observed access patterns of existing files. His research interests also include distributed systems and pedagogical techniques for introductory computer science courses. Before starting his Ph.D. research, Daniel was employed by BBN Laboratories for more than ten years, where he wrote software for planning and logistics, speech recognition and modeling, undersea warfare simulation, parallel programming tools, and Chrysalis, SunOS, and pSOS device drivers and programming interfaces for array processors, tape drives, and communication peripherals. Daniel Ellard can be contacted at ellard@eecs.harvard.edu. Margo Seltzer is a Gordon McKay Professor of Computer Science and Associate Dean for Computer Science and Engineering in the Division of Engineering and Applied Sciences at Harvard University. Her research interests include file systems, databases, and transaction processing systems. She is the author of several widely-used software packages including database and transaction libraries and the 4.4BSD log-structured file system. Dr. Seltzer spent several years working at startup companies designing and implementing file systems and transaction processing software and designing microprocessors. She is a Sloan Foundation Fellow in Computer Science, a Bunting Fellow, and was the recipient of the 1996 Radcliffe Junior Faculty Fellowship and the University of California Microelectronics Scholarship. She is recognized as an outstanding teacher and won the Phi Beta Kappa teaching award in 1996 and the Abrahmson Teaching Award in 1999. Dr. Seltzer received an A.B. degree in Applied Mathematics from Harvard/Radcliffe College in 1983 and a Ph.D. in Computer Science from the University of California, Berkeley, in 1992. Future Worknfsdump and nfsscan are works in progress. We expect that they will evolve as users experiment with them and provide feedback or requests for new functionality. In particular, we hope that users will share whatever scripts they develop to encapsulate common analyses or administrative tasks so that we may add them to the nfsdump/nfsscan distribution. We have also identified several specific areas for future work:
References[1] Blaze, Matthew A., "NFS Tracing by Passive Network Monitoring," Proceedings of the USENIX Winter 1992 Technical Conference, pp. 333-343, San Francisco, CA, January 1992.[2] Callaghan, Brent, Brian Pawlowski, and Peter Staubach, "NFS Version 3 Protocol Specification," https://www.ietf.org/rfc/rfc1813.txt, June, 1995. [3] Combs, Gerald, ethereal, https://www.ethereal.com/. [4] Curry, Dave and Jeff Mogul, nfswatch, https://freeware.sgi.com/Dist/fw_nfswatch-nfswatch_freeware6.2.tardist. [5] Dahlin, Michael, Randolph Wang, Thomas E. Anderson, and David A. Patterson, "Cooperative Caching: Using Remote Client Memory to Improve File System Performance," Proceedings of the First USENIX Symposium on Operating Systems Design and Implementation (OSDI), pp. 267-280, Monterey, CA, 1994. [6] Ellard, Daniel, Jonathan Ledlie, Pia Malkani, and Margo Seltzer, "Passive NFS Tracing of Email and Research Workloads," Proceedings of the Second USENIX Conference on File and Storage Technologies (FAST'03), pages 203-216, San Francisco, CA, March, 2003. [7] Ellard, Daniel, Jonathan Ledlie, and Margo Seltzer, "The Utility of File Names," Technical Report TR-05-03, Harvard University Division of Engineering and Applied Sciences, 2003. [8] Elprin, Nicholas and Bryan Parno, "An Analysis of Database-Driven Mail Servers," Proceedings of the 17th Large Installation Systems Administration Conference (LISA'03), San Diego, October, 2003. [9] Hitz, D., J. Lau, and M. Malcolm, "File System Design for an NFS File Server Appliance," Proceedings of the USENIX Winter 1994 Technical Conference, pp. 235-246, San Francisco, CA, January, 1994. [10] Jacobson, Van, Craig Leres, and Steven McCanne, libpcap, https://sourceforge.net/projects/libpcap/. [11] Jacobson, Van, Craig Leres, and Steven McCanne, tcpdump implementation, https://www.tcpdump.org/. [12] Moore, Andrew W., Operating System and File System Monitoring: a Comparison of Passive Network Monitoring with Full Kernel Instrumentation Techniques, Master's thesis, Monash University, 1995. [13] The NFSv4 project, https://www.nfsv4.org/. [14] Nowicki, Bill, "NFS: Network File System Protocol Specification," https://www.ietf.org/rfc/rfc1094.txt, March 1989. [15] Roselli, Drew, Jacob Lorch, and Thomas Anderson, "A Comparison of File System Workloads," USENIX 2000 Technical Conference, pp. 41-54, San Diego, CA, 2000. [16] Shepler, Spencer, Carl Beame, Brent Callaghan, Mike Eisler, David Noveck, David Robinson, and Robert Thurlow, The NFS Version 4 Protocol, https://www.ietf.org/rfc/rfc3530.txt, May, 2000. [17] Stern, Hal, Mike Eisler, and Ricardo Labiaga, Managing NFS and NIS, Second Edition, O'Reilly & Associates, 2001. [18] Sun Microsystems, Inc., nfslogd(1M), Solaris 8 Reference Manual Collection. [19] Sun Microsystems, Inc., snoop(1), Solaris 8 Reference Manual Collection. [20] Williams, Thomas and Colin Kelley, gnuplot, https://www.gnuplot.info. Footnotes: Note 1: In the context of this paper, NFS refers only to NFS version 2 protocol [14] and the NFS version 3 protocol [2]. nfsdump and nfsscan do not support version 4 of the NFS protocol [13, 16] or any variants of NFSv2 and NFSv3, although our tools may be extended to handle these protocols. |
|
This paper was originally published in the
Proceedings of the 17th Large Installation Systems Administration Conference,
October 26–31, 2003, San Diego, CA, USA Last changed: 17 Sept. 2003 aw |
|