
Our evaluation methodology is two-fold: (1) we use wide area experiments to evaluate how OverQoS performs in practice, and (2) we use simulations to get a better understanding of the OverQoS performance over a wider range of network conditions.
Wide-Area Evaluation Testbed: Using resources available in two
large wide-area test-beds namely RON [32] and
PlanetLab [28], we construct a network of 19 nodes in diverse locations: ![]() university nodes in Europe,
university nodes in Europe, ![]() site in Korea,
site in Korea,
![]() in Canada,
in Canada, ![]() company nodes,
company nodes, ![]() behind access networks (Cable,
DSL). Our main goal in choosing these nodes is to test OverQoS across
wide-area links which we believe are lossy. For this reason, we
avoided nodes at US universities connected to Internet2 which are
known to have very few losses [7].
behind access networks (Cable,
DSL). Our main goal in choosing these nodes is to test OverQoS across
wide-area links which we believe are lossy. For this reason, we
avoided nodes at US universities connected to Internet2 which are
known to have very few losses [7].
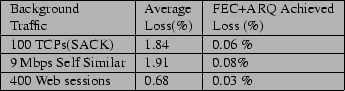
Simulation Environment: We built all the functionalities of our
OverQoS architecture on top of the ns-2 simulator version
2.1b8. Unless otherwise specified, most of our simulations use a
simple topology consisting of a single congested link of ![]() Mbps
where we vary the background traffic to realize different types of
traffic loss patterns. We use three commonly used bursty traffic
models as background traffic: (a) long lived TCP connections; (b) Self
similar traffic [36]; (c) Web traffic [15]. In
addition, we use publicly available loss traces to test the
performance of a CLVL.
Mbps
where we vary the background traffic to realize different types of
traffic loss patterns. We use three commonly used bursty traffic
models as background traffic: (a) long lived TCP connections; (b) Self
similar traffic [36]; (c) Web traffic [15]. In
addition, we use publicly available loss traces to test the
performance of a CLVL.
 |