SRUTI '05 Paper
[SRUTI '05 Technical Program]


Reducing Unwanted Traffic in a Backbone Network
Kuai Xu
University of Minnesota
kxu@cs.umn.edu
Zhi-Li Zhang
University of Minnesota
zhzhang@cs.umn.edu
Supratik Bhattacharyya
Sprint ATL
supratik@sprintlabs.com
This paper studies the techniques a backbone ISP can employ
to reduce unwanted traffic on its network.
For this purpose, we extract likely sources of
exploit (thus unwanted) traffic from packet traces
collected on backbone links using an Internet traffic behavior
profiling methodology we developed earlier. We first study the
characteristics of exploit traffic from several aspects, such as
network origins and severity.
Based on these characteristics, we propose
several heuristic rules that an ISP may pursue for reducing
unwanted traffic, and evaluate their cost and performance.
Using packet traces collected from backbone links, we
demonstrate that simple blocking strategies
could potentially reduce substantial exploit traffic
in a backbone network.
Recently we have seen a tremendous increase in unwanted or exploit
traffic [1] [2] -
malicious or unproductive traffic that attempts to compromise
vulnerable hosts, propagate malware, spread spam or deny valuable
services. A significant portion of this traffic is due to
self-propagating worms, viruses or other malware; this leads to
a vicious cycle as new hosts are infected, generating more unwanted
traffic and infecting other vulnerable hosts.
In addition to self-propagating malware, new variants of old malware
or new exploits emerge faster than ever, producing yet more unwanted traffic.
Current measures in stopping or reducing unwanted or exploit
trafficStrictly speaking, in this paper we will use the term
exploit traffic to mean traffic that is generated with the explicit
intention to exploit certain vulnerabilities in target systems - a
large subset of unwanted traffic, although frequently
we do use the two terms interchangeably. rely on various firewalls or
similar devices deployed on the end hosts or at stub
networks (i.e., networks such as enterprise or campus networks that
do not provide transit services) to block such traffic. In this
paper we are interested in the feasibility and effectiveness of
stopping or reducing unwanted traffic from the perspective of transit
networks or ISPs (Internet Service Providers), in particular that of
a backbone ISP.
As a prerequisite to stop or reduce unwanted traffic at an ISP, we first
need an effective and efficient mechanism to identify such traffic and
its sources, especially using packet header information of one-way
traffic only. In a recent work [3],
we have developed a backbone
traffic profiling methodology - using a combination of
information-theoretical and data mining techniques - to
automatically discover and
classify interesting and significant communication patterns from largely
unstructured traffic data. Using packet header traces of one-way
traffic collected on Sprint backbone links, we have demonstrated that
our methodology is capable of identifying canonical behavior patterns for
well-known servers such as the HTTP, SMTP, and DNS, as well as for
traffic generated by known or unknown exploits. In addition, our
methodology also uncovers ``unusual" behavior patterns that deviate from
the canonical profiles and thus warrant further investigation by
security analysts.
Given the exploit traffic thus identified, in this paper we consider
blocking strategies an ISP may pursue to reduce unwanted
traffic, by installing access control lists
(ACLs) on routers at entry points of an ISP.
Although most of exploit traffic is associated with a
relatively small set of (destination) ports, simply
blocking these ports from any source is, in general,
infeasible for a backbone ISP. This
is because many ports that
are vulnerable to attacks such as
port 1434 (Microsoft SQL server) [4] or port
139 (Common Internet File System for Windows) are also used by legitimate
applications run by an ISP's customers. An alternate approach is to block the
specific offending sources (and the exploit destination ports) of
exploit traffic.
However, these sources can number in tens or
hundreds of thousands for a large backbone network; hence there is a
significant scalability problem (primarily due to overheads incurred in
backbone routers for filtering traffic using ACLs) in attempting to block each
and every one of these sources. Hence this approach is likely to be most
cost-effective when
used to block the top offending sources that send a majority of
self-propagating exploit traffic, in particular,
in the early stage of a malware outbreak, to
hinder their spread.
The contributions of this paper are i) characterizing
unwanted traffic in a backbone network in terms of
their sources, severity and sequential activities;
ii) devising and evaluating possible blocking strategies for reducing
unwanted traffic in a backbone network.
The remainder of the paper is structured as follows.
In section 2 we provide a short overview
of the backbone traffic behavior methodology we have developed, and
apply it to identify individual sources that generate a
significant amount of exploit traffic in any 5-minute time period.
In section 3 we study the characteristics of extracted
exploit traffic from several aspects. In section 4
we propose several heuristic blocking rules for reducing exploit traffic
and evaluate their efficacy and trade-offs. In section 5 we
summarize our findings and outline the future work.
2 Profiling Behavior of Exploit Traffic
We provide a short overview of the backbone traffic behavior profiling
methodology we have developed in [3]. By using
a combination of information-theoretical and data mining techniques,
the profiling methodology can identify several
``canonical'' behavior profiles such as ``normal traffic'' associated
with typical servers and heavy-hitter client hosts, ``unwanted'' or exploit
traffic, as well as rare or anomalous behavior patterns. The
methodology is extensively evaluated and validated using packet header
traces collected on backbone ISP links.
The behavior profiling works by examining communication
patterns of end hosts (source and destination IP addresses)
or ports (source and destination port numbers)
that account for a significant number of
flows in a time period (5-minute is used in this and our
earlier studies). For example, for a given source IP address
(srcIP) a, the profiling process
includes i) extracting the 5-tuple
flows whose srcIP is a in the 5-minute
time period into to a cluster, Ca,
referred to as the srcIP cluster
(associated with a); ii) characterizing the
communication patterns (i.e., behavior) of a using
information-theoretical measures on the remaining
three feature dimensions of the flows, i.e., source port (srcPrt), destination port (dstPrt) and
destination IP address (dstIP). Note
that the profiling process also works for dstIP, srcPrt
or dstPrt.
Figure 1:
The RU vector distribution of the canonical behavior profiles
for significant srcIP's in L
during a 24-hour period.
![\begin{figure*}\centering
\subfigure[srcIPs with normal behavior profiles]{
\ep...
...gure/exploit.profiling.ruvector.rucube.sj-21.eps, width=2.0in}
}
\end{figure*}](img10.png) |
We introduce an information-theoretic measure - relative
uncertaintySuppose the
size of Ca
is m and X may take NX
discrete values. Moreover, P(X)
denotes a probability distribution, and
 , where mi
is the frequency or number of times we observe X
taking the value Xi. Then, the RU of X for
Ca is defined as , where mi
is the frequency or number of times we observe X
taking the value Xi. Then, the RU of X for
Ca is defined as
 , where H(X) is the (empirical) entropy of
X defined as , where H(X) is the (empirical) entropy of
X defined as
 .
(RU(X)) - to provide an index of
variety or uniformity on each of the three feature dimensions,
X = {srcPrt, dstPrt, dstIP}. Based on this measure, we define
an RU vector
to characterize the uncertainty of the three dimensions for each srcIP
cluster. Hence each srcIP cluster can be represented as a single
point in a 3-dimensional space of the RU vectors.
This leads to a behavior classification
scheme which classifies all srcIPs into various behavior classes based
on their similarity/dissimilarity in the RU vector space. In
particular, we identify three canonical behavior profiles, namely,
server profile, heavy hitter profile, and exploit profile, to which
most of srcIP clusters belong.
We have applied the framework on a diverse set of backbone links
and demonstrated the applicability of the profiling methodology to the
problem of classifying distinct behavior patterns.
For example, using the packet traces collected from an OC48 backbone
link during a 24-hour period, we
identified 418, 466 and 3728 distinct srcIPs with server, heavy
hitter and exploit behavior profiles, respectively.
Due to a lack of space, we will
only show the results for this link, L,
in this paper. The results for
other links are presented in [5]. .
(RU(X)) - to provide an index of
variety or uniformity on each of the three feature dimensions,
X = {srcPrt, dstPrt, dstIP}. Based on this measure, we define
an RU vector
to characterize the uncertainty of the three dimensions for each srcIP
cluster. Hence each srcIP cluster can be represented as a single
point in a 3-dimensional space of the RU vectors.
This leads to a behavior classification
scheme which classifies all srcIPs into various behavior classes based
on their similarity/dissimilarity in the RU vector space. In
particular, we identify three canonical behavior profiles, namely,
server profile, heavy hitter profile, and exploit profile, to which
most of srcIP clusters belong.
We have applied the framework on a diverse set of backbone links
and demonstrated the applicability of the profiling methodology to the
problem of classifying distinct behavior patterns.
For example, using the packet traces collected from an OC48 backbone
link during a 24-hour period, we
identified 418, 466 and 3728 distinct srcIPs with server, heavy
hitter and exploit behavior profiles, respectively.
Due to a lack of space, we will
only show the results for this link, L,
in this paper. The results for
other links are presented in [5].
As an example to illustrate the distinct behaviors of normal
vs. exploit traffic profiles, Figs. 1[a] and
[b] plot the points in the RU vector space
corresponding to the srcIPs belonging to the three canonical
traffic profilesFor clarity of presentation, points
belonging to the rare behavior classes, i.e., those
falling outside the three canonical behavior profiles, are excluded
in both plots. These rare behavior classes tend to also contain
anomalous or suspicious activities. See [3] for more
details.. The points are clustered in three clearly separable groups.
The points on the left side of Fig. 1[a]
belong to the server profile, where they share a strong similarity
in RU(srcPrt) (low uncertainty) and RU(dstPrt) (high
uncertainty): a server typically talks to many clients using the same service
srcPrt and randomly selected dstPrt's.
The cluster on the right side of Fig. 1[a]
belong to the heavy hitter profile, where they share a strong similarity
in RU(srcPrt) (high uncertainty), RU(dstPrt)
(low uncertainty), and have low-to-medium uncertainty in
RU(dstIP):
a heavy-hitter client host tends to talk to a limited
number of servers using randomly selected srcPrt's but the same
dstPrt. Closer inspection reveals that the srcPrt's in
the server profile almost exclusively are the
well-known service ports (e.g., TCP port 80);
whereas the majority of the dstPrt's in the heavy-hitter
profile are the
well-known service ports, but they also include some
popular peer-to-peer ports (e.g., TCP port 6346).
In contrast, the points in the exploit traffic profile
(Fig. 1[b]) all have high uncertainty in
RU(dstIP) and low uncertainty in RU(dstPrt), and fall into two categories in
terms of RU(srcPrt). Closer inspection Our
profiling approach reveals the dominant activity of a given source,
and not all activities. For example, an infect host, which sends a
large number of exploit traffic, could also send legitimate web traffic.
reveals that the dstPrts include various known exploit ports (e.g., TCP
ports 135, 137, 138, 445, UDP ports 1026-28) as well as a few high
ports with unknown vulnerabilities. They also include some well-known
service ports (e.g., TCP 80) as well as ICMP traffic (``port'' 0).
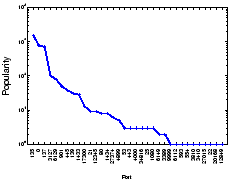
Fig. 2 plots the popularity
of the exploit ports in L
in the decreasing order, where the popularity of an
exploit port is measured by the number of sources that have an exploit
profile associated with the port.
Clearly, a large majority of these ports are associated with
known vulnerabilities and widely used by worms or viruses, e.g.,
TCP port 135 (W32/Blaster worm), TCP port 3127 (MyDoom worm).
Several well-known service ports (e.g., TCP port 80, UDP port 53, TCP
port 25) are also scanned/exploited by a few sources.
Most sources target a single exploit, however,
a small number of sources generate exploit traffic
on multiple ports concurrently. In most cases, these ports are associated with
the same vulnerability, for instance, the port combination
{TCP port 139, TCP port 445} associated with MS Window common Internet file
systems (CIFS), and {UDP ports 1026-1028} associated with MS Window
messenger pop-up spams.
Figure 2:
Port popularity of exploits traffic in L
during a 24-hour period
 |
It is worth noting that our focus is on
significant end hosts or services, so the sources we built
behavior profiles are far less than the total number of sources
seen in backbone links. Thus, it is not surprising that
our behavior profiling framework identifies a subset of
sources that send exploit traffic. However,
these sources often account for a large percentage
of exploit traffic. For example,
Fig. 3[a] shows the total number of sources
that send at least one flow on the most popular exploit port,
port 135, as well as the number of significant sources extracted by our
clustering technique that targeted port 135.
As illustrated in Fig. 3[b], the
percentage of such significant sources ranges from 0%
to 26%. However, as shown in Fig. 3[c], these significant
sources account for 80% traffic on TCP port 135 for most
intervals. This observation suggests that our profiling framework is
effective to extract most exploit traffic sent by
a small number of aggressive sources.
Figure 3:
Aggregated traffic from significant sources of
exploit on TCP port 135 over a 24-hour period (i.e., 288 five-minute periods.
![\begin{figure*}\centering
\subfigure[{\scriptsize Significant sources of exploit...
...}]{
\epsfig{file=figure/exploit.135.flowper.eps, width=2.0in}
}
\end{figure*}](fig3.png) |
3 Characteristics of Exploit Traffic
We study the characteristics of the exploit traffic from
the sources profiled as exploits in section 2
in terms of network origins, their frequency, intensity and
target footprints in the IP space. Our objective is to
shed light on effective strategies we can explore for reducing
such unwanted traffic.
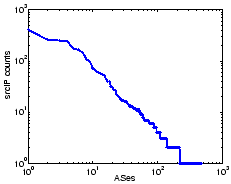
We first examine where the sources of exploit traffic are from, in terms
of their origin ASes (autonomous systems) and geographical locations.
Among the 3728 srcIPs in
L during a 24-hour period,
57 are from the private RFC1918
space [6]. These source IP addresses are likely
leaked from NAT boxes or spoofed. For the remaining srcIP's,
we search its network prefix using the
longest prefix match in a snapshot of the BGP routing table of the
same day from Route-Views [7], and obtain the AS that
originates the prefix. These 3671 srcIP's are from 468 different ASes.
Fig. 4 shows the distribution of the exploit sources among these
ASes. The top 10 ASes account for nearly 50% of the sources, and 9
out of them are from Asia or Europe.
Figure 4:
Distribution of srcIP counts across all ASes for 3728 sources
of exploit in L during a 24-hour period.
 |
We introduce several metrics to study the temporal and spatial
characteristics of exploit traffic. The frequency,
Tf measures the number of 5-minute time periods
(over the course of 24 hours) in which a source is
profiled by our methodology as having an exploit profile.
The persistence, Tp, measures (in
percentage) the number of consecutive 5-minute periods
over the total number of periods that a source sends significant
amount of exploit traffic. It is only defined for sources with
Tf >= 2. Hence
Tp = 100(%) means that
the source continuously sends significant amount of exploit traffic
in all the time slots it is observed. We use the spread,
Fs, of the
target footprint (i.e., destination IP address) to measure the number
of /24 IP address blocks that a source touches in a 5-minute time
period, and the density of the target footprint,
Fd, to measure the
(average) number of IP addresses within each /24
block that a source
touches in the period. Finally, we use the intensity, I,
to relate
both the temporal and spatial aspects of exploit traffic: it measures
the (average) number of distinct target IP addresses per minute that a
source touches in each 5-minute period.
Thus it is an indicator how fast or aggressive a source
attempts to spread the exploit.
Figure 5:
Temporal and spatial aspects of exploit traffic for the sources with
exploit profiles in the backbone link during a 24-hour period. Note that
(a) and (d) have the same index in x axis.
![\begin{figure*}\centering
\subfigure[Frequency ($T_f$) and persistence ($T_p$)]{...
...{
\epsfig{file=figure/exploit.freq.intensity.eps, width=1.5in}
}\end{figure*}](fig5.png) |
Figs. 5(a)(b)(c)(d) show the distributions of the frequency
vs. persistence, a scatter plot of the spread vs. density of target
footprint, the distribution of intensity, and the distributions of frequency
vs. intensity for the 3728 exploit sources, respectively.
From Fig. 5(a) we observe that frequency
follows a power-law like distribution: only 17.2% sources
have a frequency of 5 or more, while 82.8% sources have a frequency
of less than 5. In particular, over 70% of them have frequency of 1 or 2.
Furthermore, those 17.2% frequent (Tf >= 5)
sources account for
64.7%, 61.1% and 65.5% of the total flows, packets, and bytes of
exploit traffic. The persistence
varies for sources with similar frequency, but nearly 60% of the
sources (Tf >= 2)
have a persistence of 100 (%): these sources
continuously send exploit traffic over time and then disappear.
From Fig. 5(b) we see the exploit sources have quite
diverse target footprints. In nearly 60% cases, exploit sources touch
at least ten different /24
blocks with a density of above 20. In other words,
these sources probe an average of more than 20 addresses
in each block.
However, in about 1.6% cases,
the sources have a density of less than 5, but a spread of more
than 60. In a sense, these sources are smart in selecting the targets as they
have a low density in each block. As the rate of exploit seen
from each destination network is slow [8], they
may evade port scan detection mechanisms used, e.g., in
SNORT [9], Bro [10] or [11].
Upon close examination we find that these sources employ two main
strategies for target selections. One is to randomly generate targets
(or to use a hit-list). The other is to choose targets like
a.b.x.d or a.x.c.d , instead of a.b.c.x, where x ranges from 1 to 255,
and a, b, c, d take constant values.
The exploit intensity (Fig. 5(c)) also follows a
power-law like distribution.
The maximum intensity is 21K targets per minute, while the minimum is
40 targets per minute. There are only 12.9% sources with an intensity of over
500 targets per minute, while nearly 81.1% sources have an intensity
of less than 500 targets per minute. Those 12.9% aggressive (I >= 500)
sources account for 50.5%, 53.3%, and 45.2% of the total
flows, packets, and bytes of exploit traffic. However, as evident in
Fig. 5(d), there is no
clear correlation between frequency and intensity of exploit traffic:
the intensity of exploit activities varies across sources of similar
frequency.
In summary, we see that there is a relatively small number of
sources that frequently, persistently or aggressively generate exploit
traffic. They are candidates for blocking actions.
Whereas a small percentage of sources are also quite smart in
their exploit activities: they tend to come and go quickly,
performing less intensive probing with wide-spread, low-density target
footprint. These sources may be operated by malicious attackers as
opposed to innocent hosts infected with malware that attempt to
self-propagate. These sources need to be watched for more
carefully.
4 Initial Assessment of Blocking Strategies
In this section, we propose several heuristic rules of blocking
strategies based on characteristics of exploit activities and then
evaluate their efficacy in reducing unwanted traffic.
In order to determine which sources to block traffic from, we use the
behavior profiling technique outlined in
section 2. For every five minute
interval, we profile all sources and identify those that exhibit the
exploit traffic profile. We then devise simple rules to select some or
all of these sources as candidates for blocking. Instead of blocking all
traffic from the selected sources, we consider blocking traffic on only
the ports that a source seek to exploit. This is because exploit hosts
may indeed be sending a mixture of legitimate and exploit traffic. For
example, if an infected host behind a NAT box is sending exploit traffic,
then we may observe a mixture of legitimate and exploit traffic coming
from the single IP address corresponding to the NAT box.
For our evaluation, we start with the following benchmark rule. If a
source is profiled as an exploit source during any five minute interval,
then all traffic from this source on vulnerable ports is blocked from
then on. Fig. 6[a][b] illustrates the total
blocked flows from sources of exploit every 5-minute interval in L
and the percentage of such flows over all traffic from these sources,
respectively. Overall, the benchmark rule could block about 80% traffic
from the sources of exploit. In other words,
this rule may still not block all traffic from the source due to
two reasons. First, the source might already have been sending traffic,
perhaps legitimate, prior to the time-slot in which it exhibited the
exploit profile. Second, as explained above, only ports on which we see
exploit traffic are considered to be blocked.
Figure 6:
a) blocked flows using the benchmark rule on L
over a 24-hour period; b) percentage of blocked flows over the total
flows from sources of exploit.
![\begin{figure*}\centering
\subfigure[Blocked flows]{
\epsfig{file=figure/behavi...
...avior.exploit.monitoring.alltraffic.perflows.eps, width=2.0in}
}
\end{figure*}](fig6.png) |
While this benchmark rule is very aggressive in selecting
sources for blocking, the candidate set of source/port pairs to be added
to the ACLs of routers may grow to be very large across all links in a
network. Therefore, we consider other blocking rules that embody
additional (and more restrictive) criteria that an exploit source must
satisfy in order to be selected for blocking.
- Rule 2: an ACL entry is created if and only if the source
has been profiled with an exploit behavior on a port for n
consecutive intervals. This rule is to
block traffic from persistent sources;
- Rule 3: an ACL entry is created if and only if the source
has an average intensity of at least m flows per minute.
This rule is to block aggressive sources;
- Rule 4: an ACL entry is created if and only if the source
is exploit one of the top k popular ports. This rule is to block
exploit traffic of the popular ports;
- Rule 5: Rule 2 plus Rule 3.
We introduce three metrics, cost, effectiveness, and wastage to evaluate the efficacy of these rules. The cost
refers to the overhead incurred in a router to store and lookup the
ACLs of blocked sources/ports. For simplicity, we use the total number of
sources/ports as an index of the overhead for a blocking rule.
The effectiveness measures the reduction of unwanted traffic
in terms of flow, packet and byte counts compared with the benchmark rule.
The resource wastage refers to the number of entries in ACLs that are
never used after creations.
Table 1 summarizes these rules of blocking strategies
and their efficacy. The benchmark rule achieves the optimal performance,
but has the largest cost,
i.e., 3756 blocking entriesThe cost exceeds the total number
of unique sources of exploit since a few sources have exploit profiles on
multiple destination ports..
Rule 2 with n = 2 obtains 60% reductions of
the benchmark rule with 1585 ACL entries, while Rule 2 with
n = 3 obtains less than 40% reductions with 671 entries. Rule 3,
with m = 100 or m = 300
achieves more than 70% reductions with
2636 or 1789 entries. Rule 4 has a similar performance as
the benchmark rule, but its cost is also very high. The Rule 5,
a combination of Rule 2 and Rule 3 has a small cost, but
obtains about 40% reductions compared with the benchmark rule.
We observe that the simple rules, Rule 3 with m = 100 or m = 300
and Rule 2 with n = 2,
are most cost-effective when used to block the aggressive or frequent sources
that send a majority of self-propagating exploit traffic, in particular,
in the early stage of a malware outbreak, to hinder their spread.
Table 1:
Simple blocking strategies and their efficacy.
| Rule |
Cost |
Effectiveness (Reduction (%)) |
Wastage |
| |
|
flow |
packet |
byte |
|
| Benchmark |
3756 |
- |
- |
- |
1310 |
| Rule 2 (n=2) |
1586 |
63.0% |
61.2% |
56.5% |
505 |
| (n=3) |
671 |
38.0% |
36.0% |
31.2% |
176 |
| Rule 3 (m=100) |
2636 |
97.1% |
94.0% |
89.4% |
560 |
| (m=300) |
1789 |
84.3% |
80.4% |
72.7% |
302 |
| (m=500) |
720 |
57.6% |
57.0% |
53.1% |
68 |
| Rule 4 (k=5) |
3471 |
87.4% |
79.2% |
77.5% |
1216 |
| (k=10) |
3624 |
92.9% |
85.5% |
81.5% |
1260 |
| Rule 5 (n=2, m=300) |
884 |
48.7% |
44.0% |
37.7% |
163 |
5 Conclusions and Ongoing Work
This paper studied the characteristics
of exploit traffic using packet-level traffic traces collected from
backbone links. Based on the insights obtained, we
then investigated possible countermeasure
strategies that a backbone ISP may pursue
for reducing unwanted traffic. We proposed
several heuristic rules for blocking most offending sources of
exploit traffic
and evaluated their efficacy and performance trade-offs in reducing unwanted
traffic. Our results demonstrate that blocking the most
offending sources is reasonably cost-effective, and can potentially
stop self-propagating malware in their early stage of outburst.
We are currently performing more in-depth analysis of exploit traffic,
and correlating exploit activities from multiple links.
Ultimately we plan to
incorporate these mechanisms in a comprehensive security monitoring and
defense system for backbone ISPs.
Kuai Xu and Zhi-Li Zhang were supported in part by the National Science
Foundation under the grants ITR-0085824 and CNS 0435444 as well as ARDA
grant AR/F30602-03-C-0243. Any opinions, findings, and conclusions or
recommendations expressed in this paper are those of the authors and do
not necessarily reflect the views of the funding agencies.
We thank Travis Dawson at Sprint ATL for many helpful comments and
discussions.
-
- 1
-
V. Yegneswaran , P. Barford and J. Ullrich, ``Internet intrusions: global
characteristics and prevalence,'' in Proc. of ACM SIGMETRICS, 2003.
- 2
-
R. Pang, V. Yegneswaran, P. Barford, V. Paxson and L. Peterson,
``Characteristics of Internet Background Radiation,'' in Proc. of ACM
SIGCOMM Internet Measurement Conference, 2004.
- 3
-
K. Xu, Z.-L. Zhang and S. Bhattacharyya, ``Profiling Internet Backbone
Traffic: Behavior Models and Applications,'' in Proc. of ACM
SIGCOMM, August 2005.
- 4
-
D. Moore, V. Paxson, S. Savage, C. Shannon, S. Staniford and N. Weaver,
``Inside the Slammer Worm,'' IEEE Security and Privacy, July 2003.
- 5
-
K. Xu, Z.-L. Zhang and S. Bhattacharyya, ``Reducing Unwanted Traffic in a
Backbone Network,'' Sprint ATL Research Report RR05-ATL-040400, April
2005.
- 6
-
Y. Rekhter, B. Moskowitz, D. Karrenberg, G. J. de Groot, E. Lear, ``RFC1918:
Address Allocation for Private Internets,'' February 1996.
- 7
-
University of Oregon, ``Routeviews archive project,''
https://archive.routeviews.org/.
- 8
-
S. Staniford, J. Hoagland, and J. McAlerney, ``Practical automated detection
of stealthy portscans,'' Journal of Computer Security, vol. 10, pp.
105-136, 2002.
- 9
-
``SNORT,'' https://www.snort.org/.
- 10
-
V. Paxson, ``Bro: A System for Detecting Network Intruders in Real-Time,''
Computer Networks, Dec 1999.
- 11
-
J. Jung and V. Paxson and A. Berger and H. Balakrishna, ``Fast portscan
detection using sequential hypothesis testing,'' in Proc. of IEEE
Symposium on Security and Privacy, 2004.
Reducing Unwanted Traffic in a Backbone Network
This document was generated using the
LaTeX2HTML translator Version 2002-2-1 (1.70)
Copyright © 1993, 1994, 1995, 1996,
Nikos Drakos,
Computer Based Learning Unit, University of Leeds.
Copyright © 1997, 1998, 1999,
Ross Moore,
Mathematics Department, Macquarie University, Sydney.
The command line arguments were:
latex2html -split 0 -show_section_numbers -local_icons sruti28.tex
The translation was initiated by Kuai Xu on 2005-05-23
Kuai Xu
2005-05-23
|