|
USENIX '05 Paper
[USENIX '05 Technical Program]
Making Scheduling "Cool":
Temperature-Aware Workload Placement in Data Centers1
Justin Mooref
Jeff Chasef
Parthasarathy Ranganathanf
Ratnesh Sharmaf
|
|
f Department of Computer Science |
| Duke University |
| {justin,chase}@duke.edu |
f Internet Systems and Storage Lab |
| Hewlett Packard Labs |
| {partha.ranganathan, ratnesh.sharma}@hp.com
|
Abstract
Trends towards consolidation and higher-density computing
configurations make the problem of heat management one of the critical
challenges in emerging data centers. Conventional approaches to
addressing this problem have focused at the facilities level to
develop new cooling technologies or optimize the delivery of
cooling. In contrast to these approaches, our paper explores an
alternate dimension to address this problem, namely a systems-level
solution to control the heat generation through temperature-aware
workload placement.
We first examine a theoretic thermodynamic formulation that uses
information about steady state hot spots and cold spots in the data center
and develop real-world scheduling algorithms. Based on the insights from
these results, we develop an alternate approach. Our new approach
leverages the non-intuitive observation that the source of cooling
inefficiencies can often be in locations spatially uncorrelated with its
manifested consequences; this enables additional energy savings.
Overall, our results demonstrate up to a factor of two reduction in annual
data center cooling costs over location-agnostic workload distribution,
purely through software optimizations without the need for any costly
capital investment.
1 Introduction
The last few years have seen a dramatic increase in the number, size, and
uses of data centers. Large data centers contain up to tens of thousands
of servers and support hundreds or thousands of users. For such data
centers, in addition to traditional IT infrastructure issues, designers
increasingly need to deal with issues of power consumption, heat
dissipation, and cooling provisioning.
These issues, though traditionally the domain of facilities management,
have become important to address at the IT level because of their
implications on cost, reliability, and dynamic response to data center
events. For example, the total cooling costs for large data centers
(30,000 ft2) can run into the tens of millions of dollars. Similarly,
brownouts or cooling failures can lead to a reduced mean time between
failure and service outages, as servers that overheat will automatically
shut down. Furthermore, increases in server
utilization [7,16] or the failure of a
CRAC unit can upset the current environment in a matter of minutes or even
seconds, requiring rapid response strategies, often faster than what is
possible at a facilities level. These conditions will accelerate as
processor densities increase, administrators replace 1U servers with
blades, and organizations consolidate multiple clusters into larger data
centers.
Current work in the field of thermal management explores efficient
methods of extracting heat from the data center [23,27]. In contrast, our work explores temperature-aware
workload placement algorithms. This approach focuses on scheduling
workloads in a data center - and the resulting heat the servers
generate - in a manner that minimizes the energy expended by the
cooling infrastructure, leading to lower cooling costs and increased
hardware reliability.
We develop temperature-aware workload placement algorithms and present the
first comprehensive exploration of the benefits from these policies. Using
simple methods of observing hot air flow within a data center, we
formulate two workload placement policies: zone-based discretization
( ZBD) and minimize-heat-recirculation ( MinHR). These
algorithms establish a prioritized list of servers within the data center,
simplifying the task of applying these algorithms to real-work systems.
The first policy leverages a theoretic thermodynamic formulation based on
steady-state hot spots and cold spots in the data
center [27]. The second policy uses a new formulation based
on the observation that often the measured effects of cooling
inefficiencies are not located near the original source of the heat; in
other words, heat may travel several meters through the data center before
arriving at a temperature sensor. In both cases, our algorithms achieve
the theoretical heat distribution recommendations, given discrete power
states imposed by real-world constraints. We show how these algorithms can
nearly halve cooling costs over the worst-case placement for a simple data
center, and achieve an additional 18% in cooling savings beyond previous
work. Based on these improvements we can eliminate more than 25% of the
total cooling costs. Such savings in the 30,000 ft2 data center
mentioned earlier
translate to a a $1 - $2 million annual cost reduction. Furthermore,
our work is complementary to current approaches; given a fixed cooling
configuration, we quantify the cost of adding load to specific servers.
A data center owner can use these costs to maximize the utilization per
Watt of their compute and cooling infrastructure.
The rest of this paper is organized as follows.
Section 2 elaborates the motivation for this work and
discusses the limitations of conventional facilities-only approaches.
Section 3 describes the goals of temperature-aware
workload placement and discusses the algorithms that we propose -
ZBD and MinHR - as well as three baseline algorithms
provided for comparison. Sections 4 and 5
present our results and discuss their implications.
Section 6 concludes the paper.
2 Motivation
As yesterday's clusters grow into today's data centers, infrastructure
traditionally maintained by a facilities management team - such as
cooling and the room's power grid - are becoming an integral part of
data center design. No longer can data center operators focus solely
on IT-level performance considerations, such as selecting the
appropriate interconnect fiber or amount of memory per node. They now
need to additionally evaluate issues dealing with power consumption
and heat extraction.
For example, current-generation 1U servers consume over 350 Watts at peak
utilization, releasing much of this energy as heat; a standard 42U rack of
such servers consumes over 8 kW. Barroso et al estimate that the power
density of the Google data center is three to ten times that of typical
commercial data centers [10]. Their data center uses
commodity mid-range servers; that density is likely to be higher with
newer, more power-hungry server choices. As data centers migrate to bladed
servers over the next few years, these numbers could potentially increase
to 55 kW per rack [21].
2.1 Thermal Management Benefits
A thermal management policy that considers facilities components, such as
CRAC units and the physical layout of the data center, and
temperature-aware IT components, can:
Decrease cooling costs. In a 30,000 ft2 data center
with 1000 standard computing racks, each consuming 10 kW, the initial cost
of purchasing and installing the computer room air conditioning (CRAC)
units is $2 - $5 million; with an average electricity cost of
$100/MWhr, the annual costs for cooling alone are $4 - $8
million [23]. A data center that can run the same
computational workload and cooling configuration, but maintain an ambient
room temperature that is 5�C cooler, through intelligent
thermal management can lower CRAC power consumption by 20% - 40% for a
$1 - $3 million savings in annual cooling costs.
Increase hardware reliability.
A recent study [28] indicated that in order to avoid thermal redlining,
a typical server needs to have the air temperature at its front
inlets be in the range of 20�C - 30�C.
Every 10�C increase over 21�C decreases the
reliability of long-term electronics by
50%. Other studies show that a
15�C rise increases hard disk drive failure rates by a
factor of two [6,13].
Decrease response times to transients and emergencies.
Data center conditions can change rapidly. Sharp transient spikes
in server utilization [7,16] or the
failure of a CRAC unit can upset the current environment in a
matter of minutes or even seconds. With aggressive heat densities
in the data center, such events can result in potentially
disruptive downtimes due to the slow response times possible with
the mechanical components at the facilities level.
Increase compaction and improve operational efficiencies.
A high ratio of cooling power to compute power limits the compaction and
consolidation possible in data centers, correspondingly increasing the
management costs.
2.2 Existing Approaches
Data centers seek to provision the cooling adequately to extract the heat
produced by servers, switches, and other hardware. Current approaches to
data centers cooling provisioning are done at the facilities level.
Typically, a data center operator will add the nameplate power ratings of
all the servers in the data center - often with some additional slack
for risk tolerance - and design a cooling infrastructure based on that
number. This can lead to an excessive, inefficient cooling solution. This
problem is exacerbated by the fact that the compute infrastructure in most
data centers are provisioned for the peak (bursty) load requirement. It is
estimated that typical operations of the data center often use only a
fraction of the servers, leading to overall low server
utilization [18]. The compounded overprovisioning of
compute and cooling infrastructure drives up initial and recurring costs.
For every Watt of power consumed by the compute infrastructure, a modern
data center expends another one-half to one Watt to power the cooling
infrastructure [23,28].
In addition, the granularity of control provided in current
cooling solutions makes it difficult to identify and eliminate the
specific sources of cooling inefficiencies. Air flow within a data
center is complex, nonintuitive, and easy to
disrupt [23]. Changes to the heating
system - servers and other hardware - or the CRAC units will
take minutes to propagate through the room, complicating the
process of characterizing air flow within the room.
Past work on data center thermal management falls into one of two
categories. First, optimizing the flow of hot and cold air in the data
center. Second, minimizing global power consumption and heat generation.
The former approaches evaluate layout of the computing equipment in the
data center to minimize air flow inefficiencies (e.g., hot aisles and cold
aisles) [28] or design intelligent system controllers to
improve cold air delivery [23]. The latter approaches
focus on location-oblivious, global system power consumption (total
heat load) through the use of global power management [12,25], load balancing [11,24], and power reduction features in individual
servers [14].
2.3 Temperature-aware Workload Placement
However, these approaches do not address the potential benefits from
controlling the workload (and hence heat placement) from the point of view
of minimizing the cooling costs. Addressing thermal and power issues at
the IT level - by incorporating temperature-related metrics in
provisioning and assignment decisions - is complementary to existing
solutions. The last few years have seen a push to treat energy as a
first-class resource in hardware and operating system design, from
low-power processors to OS schedulers [29,31]. A
facilities-aware IT component operates at a finer granularity than CRAC
units. It can not only react to the heat servers generate, but control
when and where the heat arrives. During normal operations, a
temperature-aware IT component can maintain an efficient thermal profile
within the data center, resulting in reduced annual cooling costs. In
the event of a thermal emergency, IT-level actions include scaling back on
server CPU utilization, scaling CPU voltages [14],
migrating or shifting workload [22,11], and
performing a clean shutdown of selected servers.
 |
|
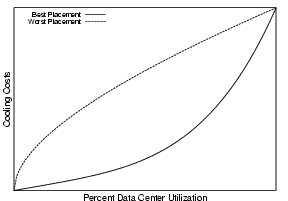
Figure 1: Approximate trends in cooling costs as a data
center's utilization increases. Workload placement algorithms affect
cooling costs by the assignment choices they make. At the extreme
ends - all servers idle and all servers used - there
are no choices. However, at all other times there exists a best and a
worst workload placement strategy.
|
Figure 1 presents an informal sketch to illustrate
the potential of this approach. The cooling costs of a data center are
plotted as a function of the data center utilization - increased
utilization produces larger heat loads, resulting in higher cooling costs.
At any given data center utilization, there is a best and worst workload
placement strategy. The difference between the two lines indicate the
potential benefits from our approach.
As Figure 1 indicates, the benefits of our approach
are limited at the two end points - a data center at "0%" utilization
or at "100%" utilization does not offer much scope for workload
placement to reduce cooling costs. In the former, all servers are idle; in
the latter, all servers are in use. In neither case do we have any choice
in how to deploy workload. The benefits from temperature-aware workload
placement exist at intermediate utilization levels when we can choose how
we place our workload. Typical data centers do not maintain 100%
utilization for extended periods of time, instead operating at mid-level
utilizations where we can leverage temperature-aware workload placement
algorithms [18].
The slope and "knee" of each curve is different for each data
center, and reflects the quality of the physical layout of the
data center. For example, a "best placement" curve with a knee
at high utilization indicates a well laid-out data center with
good air flow. However, given the inefficiencies resulting from the
coarse granularity of control in pure facilities-based approach,
we expect most data centers to exhibit a significant difference
between the worst-case and best-case curves.
3 Workload Placement Policies
At a high level, the goals of any temperature-aware workload placement
policy are to
- Prevent server inlet temperatures from crossing a pre-defined
"safe" threshold.
- Maximize the temperature of the air the CRAC units pump into the
data center, increasing their operating efficiency.
This section provides a brief overview of the thermodynamics of cooling,
how intelligent workload placement reduces CRAC unit power consumption,
and describes our placement policies.
3.1 Thermodynamics
The cooling cycle of a typical data
center operates in the following way.
CRAC units operate by extracting heat from the data center and
pumping cold air into the room, usually through a pressurized floor
plenum. The pressure forces the cold air upward through vented tiles,
entering the room in front of the hardware. Fans draw the cold air
inward and through the server; hot air exits through the rear of the
server. The hot air rises - sometimes with the aid of fans and a
ceiling plenum - and is sucked back to the CRAC units. The CRAC units
force the hot air past pipes containing cold air or water. The heat
from the returning air transfers through the pipes to the cold
substance. The now-heated substance leaves the room and goes to a
chiller, and CRAC fans force the now-cold air back into the floor
plenum.
The efficiency of this cycle depends on several factors, including the
conductive substance and the air flow velocity, but is quantified by a
Coefficient of Performance (COP). The COP is the ratio of heat
removed (Q) to the amount of work necessary (W) to remove that heat:
Therefore, the work necessary to remove heat is inversely proportional
to the COP. A higher COP indicates a more efficient process, requiring
less work to remove a constant amount of heat. For example, a cooling
cycle with a COP of two will consume 50 kW to remove 100 kW of heat, whereas a
cycle with a COP of five will consume 20 kW to remove 100 kW.
 |
|
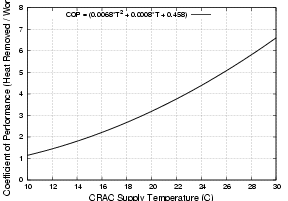
Figure 2: The Coefficient of Performance (COP) curve for
the chilled-water CRAC units at the HP Labs Utility Data Center. As the
target temperature of the air the CRAC pumps into the floor plenum
increases, the COP increases, and the CRAC expends less energy to remove
the same amount of heat.
|
However, the COP for a cooling cycle is not constant, increasing with the
temperature of the air the CRAC unit pushes into the plenum. We achieve
cost savings by raising the plenum supply temperature, moving the CRAC
units into a more efficient operating range. Figure 2
shows how the COP increases with higher supply temperatures for a typical
water-chilled CRAC unit; this curve is from a water-chilled CRAC unit in
the HP Utility Data Center. For example, if air returns to the CRAC unit
at 20�C and we remove 10 kW of heat, cooling that air to
15�C, we expend 5.26 kW. However, if we raise the plenum
supply temperature to 20�C, everything in the data center warms
by 5�C. Cooling the same volume of air, now returning at
25�C, to 20�C removes the same 10 kW of heat, but
only expends 3.23 kW. This is a power savings of almost 40%.
Consequently, our scheduling policies attempt to maximize
cooling efficiency by raising the maximum temperature
of the air coming from the CRAC units and flowing into the plenum.
Obviously, this has
to be done in a manner that maintains prevents the server inlet
temperatures from crossing their redlining thermal threshold.
3.2 Terminology
At a fundamental level, we categorize power allocation algorithms as
either analog or digital. "Analog" algorithms specify
per-server power budgets from the continuous range of real numbers
[ Po ff, Pmax ]. While analog algorithms provide a detailed
per-server budget, they are hard to implement in practice. It may be
possible to meet these goals - a data center operator may deploy
fine-grained load balancing in a web farm [8], utilize CPU
voltage scaling [14], or leverage virtual
machines [1,9] for batch workloads - but in
practice it is difficult to meet and maintain precise targets for power
consumption.
"Digital" algorithms assign one of several pre-determined discrete
power states to each server. They select
which machines should be off, idle, or in use, particularly for
workloads that fully utilize the processors. They could also
leverage the detailed relationship between server utilization and
power consumption to allow few discrete utilization states.
Additionally, a well-ordered digital algorithm will create a
list of servers sorted by their "desirability"; the list ordering is
fixed for a given cooling configuration, but does not change for
different data center utilization levels. Therefore, if data center
utilization jumps from 50% to 60%, the servers selected for use at
50% are a proper subset of those selected at 60% utilization.
Well-ordered algorithms simplify the process of integrating
cooling-aware features with existing components such as
SGE [4] or LSF [3], allowing us to use common
mechanisms such as
scheduling priorities. For example, SGE allows the administrator to
define arbitrary "consumable" resources and simple formulas to force
the scheduler to consider these resources when performing workload
placement; modifying these resource settings is only necessary after a
calibration run.
In this paper, we focus on algorithms that address the problem of
discrete power states. We specifically focus on compute-intensive batch
jobs such as multimedia rendering workloads, simulations, or distributed
computation run for several hours [5]. These jobs tend to
use all available CPU on a server, transforming the per-server power
budgets available to a data center scheduler from a continuous range of
[ Poff, Pmax ] to a discrete set of power states: { Poff,
Pidle, P1, �, PN }, where Pj is the power
consumed by a server fully utilizing j CPUs. Additionally, they also
provide sufficient time for the thermal conditions in the room to reach
steady-state. If additional power states are considered,
Section 5 discusses how our algorithms scale in a
straightforward manner.
3.3 Baseline Algorithms
We use three reference algorithms as a basis for comparison.
UniformWorkload and CoolestInlets
The first algorithm is UniformWorkload, an "intuitive" analog
algorithm that calculates the total power consumed by the data center and
distributes it evenly to each of the servers. We chose this algorithm
because, over time, an algorithm that places workload randomly will
approach the behavior of UniformWorkload. Each server in our data
center consumes 150 Watts when idle and 285 Watts when at peak
utilization. Thus, a 40% UniformWorkload will place ((285 - 150) ·0.40) + 150 = 204 Watts on each server.
The second baseline algorithm is CoolestInlets, a digital algorithm
that sorts the list of unused servers by their inlet temperatures. This
intuitive policy simply places workload on servers in the coldest part of
the data center. Such an algorithm is trivial to deploy, given an
instrumentation infrastructure that reports current server temperatures.
OnePassAnalog
The last policy is OnePassAnalog, an analog reprovisioning
algorithm based on the theoretical thermodynamic formulation by Sharma
et al [27], modified with the help of the original
authors to allocate power on a per-server basis. The algorithm works
by assigning power budgets in a way that attempts to create a uniform
exhaust profile, avoiding the formation of any heat imbalances or
"hot spots". A data center administrator runs one calibration
phase, in which they place a uniform workload on each server and
observe each server's inlet temperature. The administrator selects a
reference { power, outlet temperature } tuple,
{ Pref, Toutref }; this reference point can be one server,
or the average server power consumption and outlet temperature within a
row or throughout the data center. With this tuple, we calculate the
power budget for each server:
A server's power budget, Pi, is inversely proportional to its outlet
temperature, Touti. Intuitively, we want to add heat to cool
areas and remove it from warm areas.
It is important to note that OnePassAnalog responds to heat buildup
by changing the power budget at the location of the observed increase.
Intuitively, this is similar to other approaches - including the
motherboard's thermal kill switch - in that it addresses the observed
effect rather than the cause.
 |
|
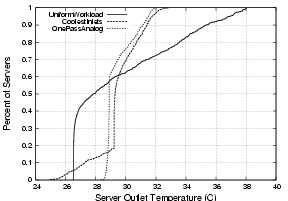
Figure 3: CDF of server exhaust temperatures for the three
reference workload placement algorithms at 60% utilization. Both
CoolestInlets and OnePassAnalog base workload placement decisions on data
center conditions. However, OnePassAnalog has the least variance in
server exhaust temperatures (4�C)
leading to fewer heat buildups in the data center. Less variance allows
us to raise CRAC supply temperatures further, increasing the COP, without
causing thermal redlining.
|
Figure 3 shows the CDF of server exhaust
temperatures for the three reference workload placement algorithms in a
data center at 60% utilization. A data center that employs
OnePassAnalog scheduling has less variance in its server's exhaust
temperatures; UniformWorkload and CoolestInlets have server
exhaust temperatures that vary by as much as
9�C - 12�C, whereas OnePassAnalog varies by
less than 4�C; this indicates fewer localized "hot spots" and
heat imbalances.
3.4 Zone-Based Discretization (ZBD)
Our first approach is based on the theoretical formulation behind
OnePassAnalog [27]. This formulation assigns heat inversely
proportional to the server's inlet temperature. However, it suffers from
the drawback that it is analog; it does not factor in the
specific discrete power states of current servers: { Pidle,
�, PN }. Therefore, the challenge is to discretize the
recommended analog distribution to the available discrete power states.
Our research showed that conventional discretization approaches - ones
that are agnostic to the notion of heat distribution and transfer - that
simply minimize the absolute error, can result in worse cooling costs.
ZoneBasedDiscretization(n, V, H, a) {
while selected less than n servers {
Get Si, idle server with max power budget
Pneed = Prun - PSi
WeightNeighbors =  ·size(V) + size(H) ·size(V) + size(H)
Pshare = Pneed / WeightNeighbors
Poach Pshare from each of the H horizontal neighbors,
(a·Pshare) from each of the V vertical neighbors
}
}
|
|
Figure 4: The core of the ZBD algorithm. n is the number
of servers we want, V is the set of neighbors along the vertical axis, H
is the set of neighbors along the horizontal axis, and is the ratio of power borrowed per-vertical to power
borrowed per-horizontal. Prun is the amount of power necessary
to run one server at 100% utilization; PSi is the
amount of power the OnePassAnalog algorithm allocates to server i. In
general, Prun > PSi.
|
The key contribution of ZBD is that, in addition to minimizing the
discretization error over the entire data center, it minimizes the
differences between its power distribution and OnePassAnalog at
coarse granularities, or geographic zones.
ZBD chooses servers by using the notions of proximity-based heat
distributions and poaching. When selecting a server on which to
place workload, the chosen server borrows, or "poaches" power from its
zone of immediate neighbors whose power budget is not already committed.
Within these two-dimensional zones, the heat
produced by ZBD is similar to that produced by OnePassAnalog.
Therefore, ZBD is an effective discretization of OnePassAnalog
by explicitly capturing the underlying goal of OnePassAnalog:
creating a uniform exhaust profile that reduces localized hot spots. A
discretization approach that does not take this goal into account loses
the benefits of OnePassAnalog.
Figure 4 describes the core of the ZBD
discretization algorithm. ZBD allows us to define a variable-sized
set of neighbors along the horizontal and vertical axes - H and
V - and a, the ratio of power taken from the vertical to
horizontal directions. These parameters enable us to mimic the physics of
heat flow, as heat is more likely to rise than move horizontally.
Consequently, "realistic" poaching runs set a larger than zero,
borrowing more heavily vertically from servers in their rack.
| 184.61 | 216.77 | 207.15 |
| 184.44 | 216.80 | 207.41 |
| 186.24 | 216.88 | 207.66 |
| 189.25 | 216.86 | 207.82 |
| 193.41 | 216.82 | 207.89 |
|
| (a) OnePassAnalog budgets |
| 184.61 | 216.77 | 207.15 |
| 184.44 | 216.80 | 207.41 |
| 186.24 | 216.88 | 207.66 |
| 189.25 | 216.86 | 207.82 |
| 193.41 | 216.82 | 207.89 |
|
| (b) Select Si and its neighbors.
Pneed = 68.12 Watts. |
| 184.61 | 203.67 | 207.15 |
| 184.44 | 203.70 | 207.41 |
| 178.38 | 285.00 | 199.80 |
| 189.25 | 203.76 | 207.82 |
| 193.41 | 203.72 | 207.89 |
|
| (c) Pshare = 7.86 Watts,
· Pshare = 13.10 Watts. |
|
Table 1: The first iteration of ZBD with n = 6, size(H) =
2, size(V) = 4, and = [5/3]. The server with the
highest power budget "poaches" power from its immediate neighbors. The
total power allotted to these fifteen servers remains constant, but we now
have a server with enough power to run at 100% utilization. At the end of
this iteration, one server has enough power to run a full workload; after
another n - 1 iterations, we will have selected
our n servers.
|
Table 1 shows the operation of ZBD at a micro
level, borrowing power from four vertical and two horizontal neighbors,
giving the center server enough of a power budget to operate. The total
amount of power and heat within the fifteen-server group remains the same,
only shifted around slightly.
3.5 Minimizing Heat Recirculation (MinHR)
Our second approach is a new power provisioning policy that minimizes the
amount of heat that recirculates within a data center: MinHR. Heat
recirculation occurs for several reasons. For example, if there is not
enough cold air coming up from the floor, a server fan can suck in air
from other sources, usually hot air from over the top or around the side
of racks. Similarly, if the air conditioning units do not pull the hot
air back to the return vents or if there are obstructions to the air flow,
hot air will mix with the incoming cold air supply. In all these cases,
heat recirculation leads to increases in cooling energy.
Interestingly, some of these recirculation effects can lead to
situations where the observed consequence of the inefficiency is
spatially uncorrelated with its cause; in other words, the heat vented
by one machine may travel several meters before arriving at the inlet of
another server. We assert that an algorithm that minimizes hot air
recirculation at the data center level will lead to lower cooling costs.
Unlike ZBD, which reacts to inefficiencies by lowering the power
budget at the site where heat recirculation is observed, MinHR
focuses on the cause of inefficiencies. That is, it may not know
how to lower the inlet temperature on a given server, but it will lower
the total amount of heat that recirculates within the data center.
Therefore, unlike ZBD, we make no effort to create a uniform exhaust
profile. The goals are to
- minimize the total amount heat that recirculates before returning to
the CRAC units.
- maximize the power budget - and therefore the potential
utilization - of each server.
First, we need a way to quantify the amount of hot air coming from a
server or a group of servers that recirculates within the data center. We
define  Q as Q as
| |
Q |
|
|
|
n

i=1
|
Cp ·mi ·(Tini - Tsup) |
| |
|
Here, n is the number of servers in the data center, Cp is the
specific heat of air (a thermodynamic constant measured with units of
[W ·sec/kg ·K]), mi is the mass flow of air through
server i in [kg/sec], Tini is the inlet temperature for
server i, and Tsup is the temperature of the cold air supplied by
the CRAC units. In a data center with no heat recirculation -
Q = 0 - each Tini
will equal Tsup.
Our workload placement algorithm will distribute power relative to the
ratio of heat produced to heat recirculated:
| |
|
|
Qi
Qi
|
|
| |
|
We run a two-phase experiment to obtain the heat recirculation data.
This experiment requires an idle data center, but it is necessary to
perform this calibration experiment once and only when there are
significant changes to the hardware within the data center; for example,
after the data center owner adds a new CRAC unit or adds new racks of
servers. The first phase has the data center run a reference workload
that generates a given amount of heat, Qref; we also measure
Qref, the amount of heat recirculating in
the data center.
For the sake of simplicity, our reference state has each server idle.
The second phase is a set of sequential experiments that measure the heat
recirculation of groups of servers. We bin the servers into pods,
where each pod contains s adjacent servers; pods do not overlap. We
define pods instead of individual servers to minimize calibration time and
to ensure that each calibration experiment generates enough heat to create
a measurable effect on temperature sensors in the data center. In each
experiment, we take the next pod, j, and maximize the CPU utilization of
all its servers simultaneously, increasing the total data center power
consumption and heat recirculation. After the new data center power load
and resulting heat distribution stabilize, we measure the new amount of
heat generated, Qj, and heat recirculating,
Qj. With these,
we calculate the Heat Recirculation Factor (HRF) for that pod, where
| |
|
|
|
Qj - Qref
Qj - Qref
|
|
| |
| |
|
| |
|
| Pod |  Qj Qj | HRFj
| [(HRFj)/SRF]
| Powerj | Qj | |
| 1 | 1000 | 2 | 0.050 | 250 | 125 |
| 2 | 400 | 5 | 0.125 | 625 | 125 |
| 3 | 250 | 8 | 0.200 | 1000 | 125 |
| 4 | 80 | 25 | 0.625 | 3125 | 125 |
|
|
Table 2: Hypothetical MinHR calibration results and
workload distribution for a 40U rack of servers divided into four pods of
10 servers each. Qref during
calibration is 2 kW; the final workload is 5 kW.
|
Once we have the ratio for each pod, we use them to distribute power
within the data center. We sum the HRF from each pod to get the
Summed Recirculation Factor (SRF). To calculate the per-pod power
distributions, we simply multiply the total power load by that pod's
HRF, divided by the SRF. This power budget distribution satisfies
both of our stated goals; we maximize the power budget of each
pod - maximizing the number of pods with enough power to run a
workload - while minimizing the total heat recirculation within the data
center. With this power distribution, each pod will recirculate the same
amount of heat.
As before, we need to discretize the analog recommendations based on the
HRF values for the power states in the servers. The scheduler then
allocates workloads based on the discretized distribution. Note that
the computed
HRF is a property of the data center and is independent of load.
Table 2 shows an example of MinHR for a 40U rack
of 1U servers divided into four pods. The resulting power budgets leads
to identical amounts of heat from each pod recirculating within the data
center. Although we could budget more power for the bottom pod to further
minimize heat recirculation, but that would reduce the power budgets for
other pods and lessen the number of available servers. Additionally, it
is likely that the bottom pod has enough power to run all 10 servers at
100% utilization; increasing its budget serves no purpose, and instead
reduces the amount of power available to other servers.
4 Results
This section presents the cooling costs associated with each workload
placement algorithm.
4.1 Data Center Model
 |
|
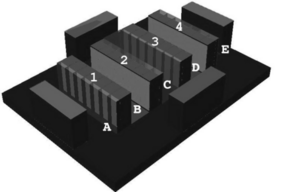
Figure 5: Layout of the data center. The data center
contains 1120 servers in 28 racks, arranged in four rows of seven racks.
The racks are arranged in a standard hot-aisle/cold-aisle
configuration [28].
Four CRAC units push cold air into a floor plenum, which then enters the
room through floor vents in aisles B and D. Servers eject hot air into
aisles A, C, and E.
|
Given the difficulties of running our experiments on a large, available
data center, we used Flovent [2], a Computational Fluid
Dynamics (CFD) simulator, to model workload placement algorithms and
cooling costs of the medium-sized data center shown in
Figure 5. This methodology has been validated in
prior studies [27].
The data center contains four rows with seven 40U racks each, for a total
of 28 racks containing 1120 servers. The data center has alternating
"hot" and "cold" aisles. The cold aisles, B and D, have vented
floor tiles that direct cold air upward towards the server inlets. The
servers eject hot air into the remaining aisles: A, C, and E.
The data center also contains four CRAC units, each having the COP curve
depicted in Figure 2. Each CRAC pushes air chilled to
15�C into the plenum at a rate of 10,000 [(ft3)/min].
The CRAC fans consume 10 kW each.
The servers are HP Proliant DL360 G3s; each 1U DL360 has a measured power
consumption of 150W when idle and 285W with both CPUs at 100%
utilization. The total power consumed and heat generated by the data
center is 168 kW while idle and 319.2 kW at full utilization. Percent
utilization is measured as the number of machines that are running a
workload. For example, when 672 of the 1120 servers are using both their
CPUs at 100% and the other 448 are idle, the data center is at 60%
utilization. To save time configuring each simulation, we modeled each
pair of DL360s as a 2U server that consumed 300W while idle and 570W while
at 100% utilization.
Calculating Cooling Costs
At the conclusion of each simulation, Flovent provides the inlet and
exhaust temperature for each object in the data center. We calculate the
cooling costs for each run based on a maximum safe server inlet
temperature, Tinsafe, of 25�C, and the maximum observed
server inlet temperature, Tinmax. We adjust the CRAC supply
temperature, Tsup, by Tadj, where
If Tadj is negative, it indicates that a server inlet exceeds our
maximum safe temperature. In response, we need to lower Tsup to
bring the servers back below the system redline level.
Our cooling costs can be calculated as
| |
|
|
Q
COP(T = Tsup + Tadj)
|
+ Pfan |
| |
|
where Q is the amount of power the servers consume, COP(T = Tsup + Tadj) is our COP at Tsup + Tadj, calculated from the curve in
Figure 2, and Pfan is the total power consumed by
the CRAC fans. Currently we assume a uniform Tsup from each CRAC due
to the complications introduced by non-uniform cold air supply; we discuss
these complications, proposed solutions, and ongoing work in
Section 5.
4.2 Baseline Algorithms
 |
|
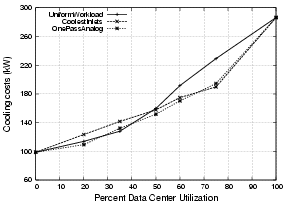
Figure 6: OnePassAnalog is consistently low, indicating a
potential "best" cooling curve described in Figure 1. UniformWorkload performs well at low
utilizations, but lacks the ability to react to changing conditions at
higher utilizations. CoolestInlets performs well at higher utilizations,
but is more expensive at low-range and mid-range utilization.
|
Figure 6 shows the cooling costs for our three
baseline algorithms. UniformWorkload performs well at low
utilization by not placing excessive workload on servers that it
shouldn't. At high utilization, though, it places workload on all
servers, regardless of the effect on cooling costs. In contrast, we see
that OnePassAnalog performs well both at high and low data center
utilization. It reacts well as utilization increases, scaling back the
power budget on servers whose inlet temperatures increase. This avoids
creating hot spots in difficult-to-cool portions of the room that would
otherwise cause the CRAC units to operate less efficiently.
CoolestInlets does well at high and mid-range utilization for this data
center, but is about 10% more expensive than OnePassAnalog at low
and moderate utilization.
Parameter Selection
For ZBD to mimic the behavior of OnePassAnalog, we need to
select parameters that reflect the underlying heat flow. Heat rises, so
we set our a to be greater than 1, and our vertical neighborhood to
be larger than our horizontal neighborhood. Our simulated servers are 2U
high; therefore our servers are 8.89cm (3.5in) tall and 60.96cm (24in)
wide. Since heat intensity is inversely proportional to the square of the
distance from the source, it makes little sense to poach two servers or
more (greater than one meter) in either horizontal direction. Noting that
our rows are 20 servers high and 7 across, we maintain this ratio both in
poaching distance and poaching ratio. We set our vertical neighborhood to
be three servers in either direction, and our a to [20/7].
These parameters are simple approximations; in section 5 we
discuss methods of improving upon ZBD parameter selection.
Results
| Zone Size | Avg Power | UW CoV | ZBD CoV |
| 2U | 462 | 0.009 | 0.008 |
| 4U | 924 | 0.012 | 0.009 |
| 8U | 1848 | 0.018 | 0.006 |
| 10U | 2310 | 0.020 | 0.006 |
|
|
Table 3: Coefficient of variance (CoV) of differences in zonal
power budgets between OnePassAnalog and the UniformWorkload
(UW) and the ZBD algorithms at 60% utilization. Small coefficients
indicate a distribution that mimics OnePassAnalog closely, creating
a similar exhaust profile.
|
The next question is whether we met our goals of matching the high-level
power allocation behavior of OnePassAnalog. In order to quantify the
similarity of any two algorithms' power distributions, we break each 40U
rack into successively larger zones; zones are adjacent and do not
overlap. We sum the servers' power allocations to get that zone's
budget. Table 3 shows the per-pod variance
between the OnePassAnalog zone budgets those of
UniformWorkload and ZBD power distributions are to the
OnePassAnalog power budgets at different granularities. Unsurprisingly,
UniformWorkload has the largest variance at any zone size; it
continues to allocate power to each server, regardless of room conditions.
However, ZBD closely mirrors the power distribution budgeted by
OnePassAnalog.
 |
|
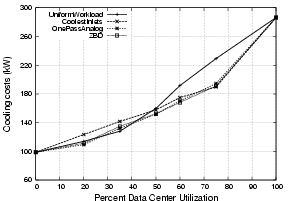
Figure 7: ZBD compared to our baseline algorithms. ZBD
also works well at high and low utilizations, staying within
+/- 3% of OnePassAnalog.
|
Figure 7 shows the relative costs of ZBD against
our three baseline algorithms as we ramp up data center utilization.
Like OnePassAnalog, ZBD performs well both at low and high
utilizations. Most importantly, we see that ZBD mimics the behavior
and resulting cooling costs of OnePassAnalog within two percent.
Even with intuitive parameter selection and the challenge of discretizing
the analog distribution, we met or exceeded the savings available using
the theoretical best workload assignment algorithm from previously
published work.
Calibration
 |
|
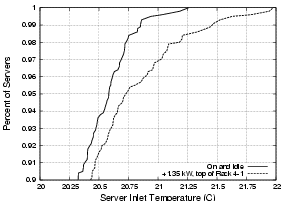
Figure 8: CDF of the warmest ten percent of server inlets
for the MinHR phase-one calibration workload, and after adding a total of
1.35 kW to ten servers during a phase-two recirculation workload. A
1�C increase in the maximum server
inlet temperature results in 10% higher cooling costs. This phase-two
workload was at the top corner of row 4.
|
The performance of MinHR depends on the accuracy of our calibration
experiments. Our goals in selecting calibration parameters for
MinHR, such as pod sizes and our Qref, were to allow for a
reasonable calibration time and a reasonable degree of accuracy. If pod
sizes are too small, we may have too many pods and an unreasonably long
real-world calibration time - approximately twenty minutes per
pod - and the Qi may to too small to create any
observable change. Since calibration times using Flovent are
significantly longer than in real life - one to two hours per pod - we
chose a pod size of 10U. This translates to a 1.35 kW Qi, as we
increase each server from 150W to 285W. While smaller pods may give us
data at a finer granularity, the magnitude of Q may be too
small to give us an accurate picture of how that pod's heat affects the
data center.
Figure 8 demonstrates the importance of locating
the sources of heat recirculation. It shows the warmest 10% of server
inlets for our calibration phase and for the recirculation workload at the
top pod of a rack on the end of row 4. Even though we increase the total
power consumption of the servers by only 0.80% (1.35 kW), the cooling
costs increase by 7.56%. A large portion of the hot exhaust from these
servers does not return to a CRAC unit, instead returning to the servers.
Inlets at the top of row 4 increase by over 1�C, and servers at
the same end of row 3 see an increase in inlet temperature of over
[2/3]�C.
 |
|
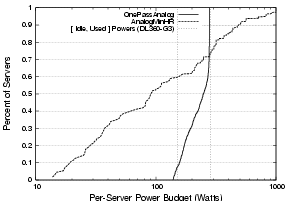
Figure 9: CDF of OnePassAnalog and AnalogMinHR budgets at
60% utilization. OnePassAnalog budgets fall within the DL360's operating
range; this facilitates ZBD's zone-based discretization. The minimum and
maximum AnalogMinHR budgets are more than an order of magnitude outside
this range, eliminating the need for or effectiveness of any
discretization algorithm.
|
With MinHR, unlike OnePassAnalog, it was not necessary to
perform any form discretization on the analog power budgets from.
Figure 9 shows the CDF of server power budgets
while our data center is at 60% utilization. In OnePassAnalog, of
the 1120 servers, only 84 fall outside the operating range of our DL360s,
thus necessitating the use of ZBD.
However, MinHR assigns power budgets between 13 and 3876 Watts per
1U server, with only 160 falling within the operating range; we chose
simply to sort the servers by their power budget and chose the X% with
the highest budgets, where X is our target utilization. We define
AnalogMinHR as the original, unrealistic power distribution, and the
sort-and-choose as DigitalMinHR. For the sake of clarity, we define
DigitalMaxHR as DigitalMinHR in reverse; we start at the
bottom of the list, using the worst candidates and moving up.
Results
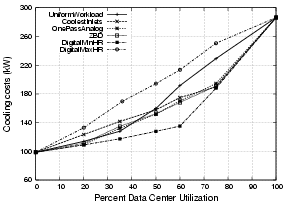
(a) Cooling costs for our baseline algorithms, ZBD,
and best and worst heat-recirculation-based algorithms.
|
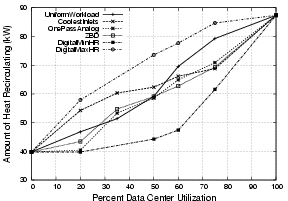
(b) The amount of heat recirculating. Note that the
increase in heat recirculation closely mirrors the increase in cooling
costs.
|
|
Figure 10: At mid-range utilizations, DigitalMinHR costs 20%
less than OnePassAnalog, 30% less than UniformWorkload and
almost 40% less than the worst possible workload distribution.
|
Figure 10(a) compares our four previous algorithms against
DigitalMinHR and DigitalMaxHR. At mid-range utilization,
DigitalMinHR saves 20% over OnePassAnalog, 30% over
UniformWorkload, and nearly 40% over DigitalMaxHR. The costs of
each algorithm are related to the heat recirculation behaviors they cause.
At low utilization, DigitalMaxHR quickly chooses servers whose
exhaust recirculates extensively, whereas DigitalMinHR does not save
much over OnePassAnalog; this indicates that initially
OnePassAnalog also minimizes heat recirculation. As utilization
increases, however, all algorithms except DigitalMinHR end up
placing load on servers that recirculate large amounts of heat;
DigitalMinHR knows exactly which servers to avoid. At near-peak
utilizations, however, DigitalMinHR has run out of "good" servers
to use, driving up cooling costs.
Figure 10(b) graphs Q for each
algorithm. DigitalMinHR achieves its goal, minimizing recirculation
and cooling costs until there are no "good" servers available.
Conversely, DigitalMaxHR immediately chooses "bad" servers,
increasing power consumption by 30.2 kW and heat recirculation by 18.1 kW.
Note that cooling costs are closely related to the amount of heat
recirculating within the data center.
4.5 ZBD and MinHR Comparison
At a glance, DigitalMinHR provides significant savings over all
other workload placement algorithms. It directly addresses the cause of
data center cooling inefficiencies, and is constrained only by the
physical air flow design of the data center. Unfortunately, the
calibration phase is significantly longer than the one ZBD requires.
A real-world calibration of our model data center would take 56 hours;
this is not unreasonable, as the entire calibration run would complete
between Friday evening and Monday morning. However, a calibration run is
necessary whenever the physical layout of the room changes, or after a
hardware or cooling upgrade. Conversely, ZBD is consistent and the
best "reactive" digital algorithm. It only requires one calibration
experiment; for our data center, this experiment would complete within a
half-hour.
Ultimately, the data center owner must decide between long calibration
times and savings in cooling costs. If the cooling configuration or
physical layout of the data center will not change often, then a
MinHR-based workload placement strategy yields significant savings.
5 Discussion
Additional Power States
Our previous experiment assumes the computer infrastructure only had
two power states: idle and used. However, many data center management
infrastructure components - such as networked power switches, blade
control planes, and Wake-On-LAN-enabled Ethernet cards - allow us to
consider "off" as another power state. Both the algorithms can
leverage additional power states to allow them to more closely match
the analog power budgets.
To demonstrate the potential for increased improvements, we focus on
some experiments using the best algorithm from the last section.
DigitalMinHR's per-pod HRF values allow us to sort servers by heat
recirculation and power down or fully turn off the "worst" servers.
Table 4 presents the results of turning 5, 10, and
15% of the "worst" servers off during 75% utilization while using
the DigitalMinHR placement algorithm. Initially the computer
infrastructure was consuming 281.4 kW, and expending 187.9 kW to
remove this heat. Turning off only 56 servers, 8.4 kW of compute
power, reduces cooling costs by nearly one-sixth. MinHR with an
"off' option reduces cooling costs by nearly another third by turning
off 20% of the servers.
When compared to the savings achieved by OnePassAnalog over
UniformWorkload, this approach represents a factor of three increase in
those cooling savings, reducing UniformWorkload cooling costs by
nearly 60%. These long-term savings may be reduced, however, by the
decreased hardware reliability caused by power-cycling servers.
| # Off | Power (kW) | Cooling (kW) | % Savings |
| 56 | 273.0 | 156.9 | 16.54 |
| 112 | 264.6 | 142.9 | 23.96 |
| 168 | 256.2 | 134.4 | 28.51 |
| 224 | 247.8 | 126.00 | 32.96 |
|
|
Table 4: We leverage MinHR's sorted list of server
"desirability" to select servers to turn off during 75% utilization.
We reduce the power consumed by the computer infrastructure by 12%, yet
reduce cooling costs by nearly one-third.
|
How far to perfection?
In this section, we compare our results to the absolute theoretical
minimum cost of heat removal, as defined by physics. It is possible to
calculate the absolute minimum cooling costs possible, given the COP curve
of our CRAC units. Assume we formulate the perfect workload placement
algorithm, one that eliminates hot air recirculation. In that case, we
have the situation described in Section 3.5: CRAC
supply temperatures equal the maximum safe server inlet temperatures.
Plugging the data from the COP curve in figure 2, we
obtain Woptimal = [Q/4.728].
 |
|
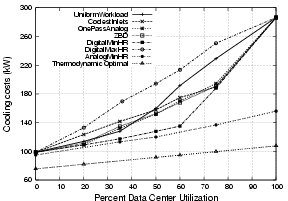
Figure 11: Cooling costs for all workload placement
algorithms, AnalogMinHR, and the absolute minimum costs for our data
center.
|
Figure 11 compares all our workload placement
algorithms against the absolute minimum costs, as governed by the
above equation. It should be noted that the absolute minimum
represents a realistically unobtainable point as is evident from the
benefits it can obtain even at the 100% data point where there is no
slack in workload placement. However, in spite of this, for our simple
data center at mid-range workloads, DigitalMinHR achieves over
half the possible savings as compared to UniformWorkload. These
savings are through changes a data center administrator can make
entirely at the IT level in software, such as modifying a batch queue
or other server assignment scheduler. Furthermore, as discussed
earlier, these changes are complementary to other facilities
approaches, including improved rack locations and cooling
configurations.
Instrumentation and Dynamic Control
The work discussed in this paper assumes an instrumentation
infrastructure in the data center such as Splice [19] that
provides current temperature and power readings to our
algorithms. Related work in the data instrumentation space includes
PIER [15], Ganglia [26] and
Astrolabe [30]. Additionally, algorithms such as
OnePassAnalog, ZBD, and MinHR include calibration
phases based on past history. These phases could potentially be sped
by systematic thermal profile evaluations through a synthetic workload
generation tool such as sstress [20]. A
moderately-sized data center of 1000 nodes will take about two days to
calibrate fully. At the end of the calibration phase, however,
which we will have the power budgets for that data center. These
budgets are constant unless the cooling or computational configuration
changes, such as by adding or removing servers.
Further, the work discussed in this paper pertains to static workload
assignment in a batch scheduler to reduce cooling costs from a heat
distribution perspective. We assume that the cooling configuration is
not being optimized concurrently; in other words, CRAC units may not
vary their supply temperatures individually, or change their fan
speeds at all. However, some data centers exist where aggressive
cooling optimizations could concurrently vary the cooling
configurations.
For these scenarios, we are currently exploring the possibility of using
system identification techniques from control
theory [17] to "learn" how the thermal profile of the
data center changes as cooling settings change. These identification
tools will reveal the relationships between cooling parameters and heat
recirculation observations, allowing us to expand the uses of
temperature-aware workload placement to include such features as emergency
actions in the event of CRAC unit failure. For the time being, however, a
data center owner could perform one calibration phase with each CRAC unit
off to simulate the failure of that unit and obtain the relative power
budgets and server ordering.
6 Conclusion
Cooling and heat management are fast becoming the key limiters for
emerging data center environments. As data centers grow during the
foreseeable future, we must expand our understanding of cooling technology
and how to apply this knowledge to data center design from an IT
perspective. In this paper, we explore temperature-aware resource
provisioning to control heat placement from a systems perspective to
reduce cooling costs.
We explore the physics of heat transfer, and present methods for
integrating it into batch schedulers. To capture the complex
thermodynamic behavior in the data center, we use simple heuristics that
use information from steady-state temperature distribution and simple
cause-effect experiments to calibrate sources of inefficiencies. To
capture the constraints imposed by real-world discrete power states, we
propose location-aware discretization heuristics that capture the notion
of zonal heat distribution, as well as recirculation-based
placement. Our results show that these algorithms can be very
effective in reducing cooling costs. Our best algorithm nearly halves
cooling costs when compared to the worst-case scenario, and represents a
165% increase in the savings available through previously published
methods. All these savings are obtained purely in software without any
additional capital costs. Furthermore, our results show that these
improvements can be larger with more aggressive use of power states, as is
likely in future systems.
Though we focus mainly on cooling costs in this paper, our algorithms
can also be applied to other scenarios such as graceful degradation
under thermal emergencies. In these cases, compared to longer
timescales associated with the more mechanical-driven facilities
control, temperature-aware workload placement can significantly
improve the response to failures and emergencies. Similarly, the
principles underlying our heuristics can be leveraged in the context of
more complex dynamic control algorithms as well.
In summary, as future data centers evolve to include ever larger
number of servers operating in increasingly denser configurations, it
will become critical to have heat management solutions that go beyond
conventional cooling optimizations at the facilities level. We believe
that approaches like ours that straddle the facilities and systems
management boundaries to holistically optimize for power, heat, and
cooling, will be an integral part of future data center solutions to
address these challenges.
A Acknowledgments
We would like to thank Tzi-cker Chiueh, our shepherd, and the anonymous
reviewers for their comments and suggestions. Janet Wiener provided
invaluable aid in refining ZBD. Keith Farkas has contributed
throughout the research and development process as we work to deploy our
work in a live data center. We would also like to thank Chandrakant
Patel, Cullen Bash, and Monem Beitelmal for their assistance with all
things cooling.
Special thanks to Rocky Shih, our Flovent guru.
References
- [1]
-
VMware - Virtual Computing Environments.
http://www.vmware.com/.
- [2]
-
Flovent version 2.1, Flometrics Ltd, 81 Bridge Road, Hampton Court, Surrey,
KT8 9HH, England, 1999.
- [3]
-
LSF Scheduler from Platform Computing, October 2004.
http://www.platform.com/products/LSF/.
- [4]
-
Sun Grid Engine, October 2004.
http://wwws.sun.com/software/gridware/.
- [5]
-
The Seti @ Home Project, October 2004.
http://setiathome2.ssl.berkeley.edu/.
- [6]
-
D. Anderson, J. Dykes, and E. Riedel.
More Than an Interface-SCSI vs. ATA.
In Proceedings of the 2nd Usenix Conference on File and Storage
Technologies (FAST), San Francisco, CA, March 2003.
- [7]
-
M. Arlitt and T. Jin.
Workload characterization of the 1998 world cup web site.
Technical Report HPL-1999-35R1, HP Research Labs, September 1999.
- [8]
-
M. Aron, D. Sanders, P. Druschel, and W. Zwaenepoel.
Scalable Content-Aware Request Distribution in Cluster-Based Network
Servers.
In In Proceedings of the USENIX 2000 Technical Conference,
2000.
- [9]
-
P. Barham, B. Dragovic, K. Faser, S. Hand, T. Harris, A. Ho, R. Neugebauer,
I. Pratt, and A. Warfield.
Xen and the Art of Virtualization.
In Proceedings of the 19th Symposium on Operating Systems
Principles, Bolton Landing, New York, October 2003.
- [10]
-
L. A. Barroso, J. Dean, and U. Holzle.
Web Search for a Planet: The Google Cluster Architecture.
In IEE Micro, pages 22-28, March-April 2003.
- [11]
-
D. J. Bradley, R. E. Harper, and S. W. Hunter.
Workload-based Power Management for Parallel Computer Systems.
IBM Journal of Research and Development, 47:703-718, 2003.
- [12]
-
J. S. Chase, D. C. Anderson, P. N. Thakar, A. M. Vahdat, and R. P. Doyle.
Managing energy and server resources in hosting centers.
In Proceedings of the 18th ACM Symposium on Operating System
Principles (SOSP), pages 103-116, October 2001.
- [13]
-
G. Cole.
Estimating Drive Reliability in Desktop Computers and Consumer
Electronics.
In Technology Paper TP-338.1, Seagate Technology, November
2000.
- [14]
-
K. Flautner and T. Mudge.
Vertigo: Automatic Performance-Setting for Linux.
In Proceedings of the 5th Symposium on Operating Systems Design
and Implementation, pages 105-116, Boston, Massachusetts, December 2002.
ACM Press.
- [15]
-
R. Huebsch, J. M. Hellerstein, N. L. Boon, T. Loo, S. Shenker, and I. Stoica.
Querying the Internet with PIER.
In Proceedings of 19th International Conference on Very Large
Databases (VLDB), September 2003.
- [16]
-
J. Jung, B. Krishnamurthy, and M. Rabinovich.
Flash Crowds and Denial of Service Attacks: Characterization and
Implications for CDNs and Web Sites.
In In Proceedings of the 2002 International World Wide Web
Conference, pages 252-262, May 2002.
- [17]
-
M. Karlsson, C. Karamanolis, and X. Zhu.
Triage: Performance Isolation and Differentiation for Storage
Systems.
In Proceedings of the Twelfth International Workshop on Quality
of Service, pages 67-74, June 2004.
- [18]
-
J. D. Mitchell-Jackson.
Energy Needs in an Internet Economy: A Closer Look at Data Centers.
Master's thesis, University of California, Berkeley, 2001.
- [19]
-
J. Moore, J. Chase, K. Farkas, and P. Ranganathan.
A Sense of Place: Toward a Location-aware Information Plane for Data
Centers.
In Hewlett Packard Technical Report TR2004-27, 2004.
- [20]
-
J. Moore, J. Chase, K. Farkas, and P. Ranganathan.
Data Center Workload Monitoring, Analysis, and Emulation.
In Eighth Workshop on Computer Architecture Evaluation using
Commercial Workloads, February 2005.
- [21]
-
J. Mouton.
Enabling the vision: Leading the architecture of the future.
In Keynote speech, Server Blade Summit, 2004.
- [22]
-
S. Osman, D. Subhraveti, G. Su, and J. Nieh.
The Design and Implementation of Zap: A System for Migrating
Computing Environments.
In Proceedings of the 5th Symposium on Operating Systems Design
and Implementation, pages 361-376, Boston, Massachusetts, December 2002.
- [23]
-
C. D. Patel, C. E. Bash, R. Sharma, and M. Beitelmal.
Smart Cooling of Data Centers.
In Proceedings of the Pacific RIM/ASME International Electronics
Packaging Technical Conference and Exhibition (IPACK03), July 2003.
- [24]
-
E. Pinheiro, R. Bianchini, E. Carrera, and T. Heath.
Load Balancing and Unbalancing for Power and Performance in
Cluster-Based Systems.
In Proceedings of the Workshop on Compilers and Operating
Systems for Low Power, September 2001.
- [25]
-
K. Rajamani and C. Lefurgy.
On Evaluating Request-Distribution Schemes for Saving Energy in
Server Clusters.
In Proceedings of the IEEE International Symposium on
Performance Analysis of Systems and Software, March 2003.
- [26]
-
F. D. Sacerdoti, M. J. Katz, M. L. Massie, and D. E. Culler.
Wide Area Cluster Monitoring with Ganglia.
In Proceedings of the IEEE Cluster 2003 Conference, Hong
Kong, 2003.
- [27]
-
R. K. Sharma, C. L. Bash, C. D. Patel, R. J. Friedrich, and J. S. Chase.
Balance of Power: Dynamic Thermal Management for Internet Data
Centers.
IEEE Internet Computing, 9(1):42-49, January 2005.
- [28]
-
R. F. Sullivan.
Alternating Cold and Hot Aisles Provides More Reliable Cooling for
Server Farms.
In Uptime Institute, 2000.
- [29]
-
A. Vahdat, A. R. Lebeck, and C. S. Ellis.
Every joule is precious: The case for revisiting operating system
design for energy efficiency.
In Proceedings of the 9th ACM SIGOPS European Workshop,
September 2000.
- [30]
-
R. van Renesse and K. P. Birman.
Scalable Management and Data Mining using Astrolabe.
In Proceedings for the 1st International Workshop on
Peer-to-Peer Systems, Berkeley, CA, February 2003.
- [31]
-
H. Zeng, X. Fan, C. Ellis, A. Lebeck, and A. Vahdat.
ECOSystem: Managing Energy as a First Class Operating System
Resource.
In Proceedings of Architectural Support for Programming
Languages and Operating Systems, October 2002.
Footnotes:
1
This work is supported in part by HP Labs, and the U.S. National Science Foundation
(EIA-9972879, ANI-0330658, and ANI-0126231).
|
