USENIX supports diversity, equity, and inclusion and condemns hate and discrimination.
RRDtool First Steps
In order to manage something, you must be able to measure it. Metrics are absolutely vital to everything we do in our professional lives. If we didn't use metrics to determine functionality, we might as well cast dice to diagnose problems. We thrive on information, and we use it to make important decisions that have very tangible ramifications.
Tobi Oetiker has dedicated most of his life to developing ways to improve the ways that we store and make this information available. Many people are familiar with MRTG, a data graphing program that was (and in some places, still is) popular for visualizing data over time.
MRTG had some drawbacks that were cumbersome (only being able to graph 2 metrics, unable to graph values below 0, etc) which led Tobi to create RRDtool, a much more fully-featured solution to storing, retrieving, and displaying information.
Although I've used RRDtools lightly before (and you may have too, through using one of the many graphing solutions that rely on it), I've never really dived into how it stored the data, and how to manually properly wrangle the databases themselves. This course was a great introduction, and was exactly what I was looking for.
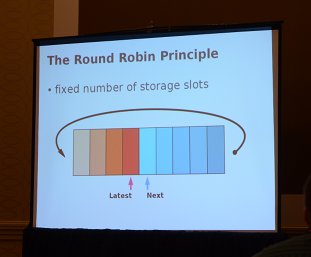
Speaking abstractly, RRDtool takes data from a datasource (which is defined as being anything with numbers) and stores it in a "Round Robin Archive", a concept which is explained by this slide:

You can think of a Round Robin Archive as a bit like a ferris wheel full of buckets. You fill up the bucket currently at the bottom, then rotate the wheel by one step, and fill up the next bucket. When you eventually come to a bucket that you've already filled, you empty it and fill it with new stuff. And so on.
In addition to storing data, RRDtool has functionality to create graphs from this data, which was something covered in the second half of this class.
Like any other database, you MUST plan before executing the creation. The structure of the RRA can't be changed after it has been created (although you can export and import into a new DB, it's computationally expensive).
Tobi displayed several examples of creating round robin databases (RRDs), which are the files that hold the RRAs (and indeed, each file can hold multiple RRAs). It might be advantageous to look at some examples to really grok what's happening. Administration and management of RRDs is done with the command 'rrdtool':
$ rrdtool create first.rrd --step=300 \
DS:speed:GAUGE:500:0:300 \
RRA:AVERAGE:0.5:1:120 \
RRA:AVERAGE:0.5:12:96
Almost certainly, that looks more complex than it is.
Looking at each line, the first (with the rrdtool command) uses the 'create' command to initialize the RRD file 'first.rrd', and it specifies --step=300. The step is the interval in seconds that the database will be expected to have data submitted to it. In this case, the database will have a data resolution of 5 minutes.
The second line, which begins with DS, specifies a Data Source, in this case called "speed", which is of a type called GAUGE (there are also COUNTERs and other types, which you can read about on the rrdcreate documentation page), that the interval between updates must be at most 500 seconds, that the data has a minimum acceptable value of 0, and that the maximum acceptable value is 300.
The third and fourth lines are creating actual Round Robin Archives. The fields of these lines are determining that the AVERAGE should be stored, that at least half of the data must not be "Unknown" in order to store data meaningfully, that data will be stored every 1 (or 12, on the last line) intervals (as determined by the step flag on the first line), and that there will be space for 120 (or 96) entries in the archive.
This sounds like a lot, and it is, but you will find that RRDtool has excellent documentation. In Tobi's own words, he doesn't accept patches to the software unless the author also patches the documentation.
Although I'm not going to get into the 'how's of storing or graphing data in RRD, I can assure you that I have a much clearer picture of it now, and it's no where near as complex as I had convinced myself that it was. I really feel like I can go out and start using RRDtool on my own, and not rely on things like Cacti to do it for me.
One other thing that Tobi talked about, and I want to bring up, is that when you are designing graphs, you need to keep in mind the audience that you'll be presenting to. Each graph sends a message, and you may have a particular goal or message to convey with your presentation. I was a fan of the book Nudge, which advocated making design decisions which passively led people to making better choices for themselves and their organization. Considering your graph designs (and their ramifications) is a step that you should take - think about what you do. Well designed graphs won't wow people with their design, but with their content. As Tobi said, "If your audience remembers your design, then you have missed your goal".
I also think it's important to remember that there are cultural differences in how we interpret things like color choices. In different cultures, colors have different meanings. The same red color that we interpret as 'danger' may mean 'happiness and prosperity' to someone else - something to keep in mind.
Overall, I was very happy with the class as it was presented. Although S5 was a half-day course, it is followed after lunch by S10, RRDTool Advanced Topics, so training was available regardless of skill level. Tobi did a great job teaching, as always, and I'd really recommend taking this class if you have any interest at all in using RRDtool to graph things in your life.
