Home
Building Cutting Edge Communities
Since 1975, USENIX has brought together a community of engineers, system administrators, scientists, and technicians working on the cutting edge of the computing world.
Community & Collaboration
Membership
The support and participation of our members is what makes us able to offer some of the most highly respected conferences and publications in the industry.
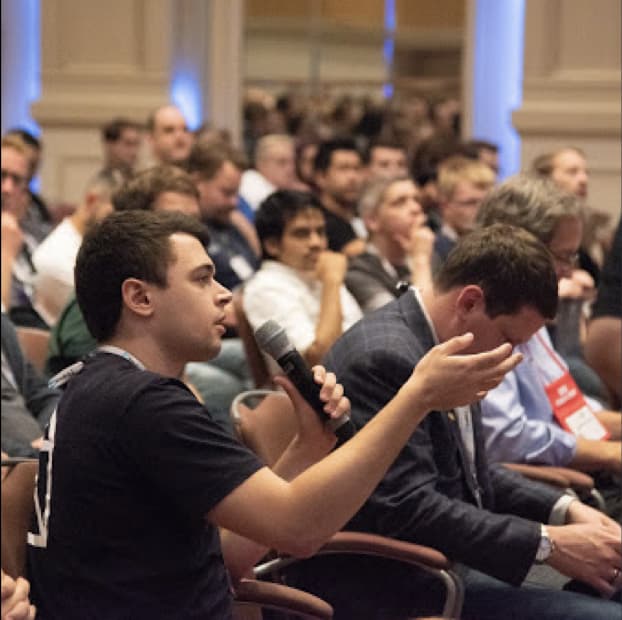
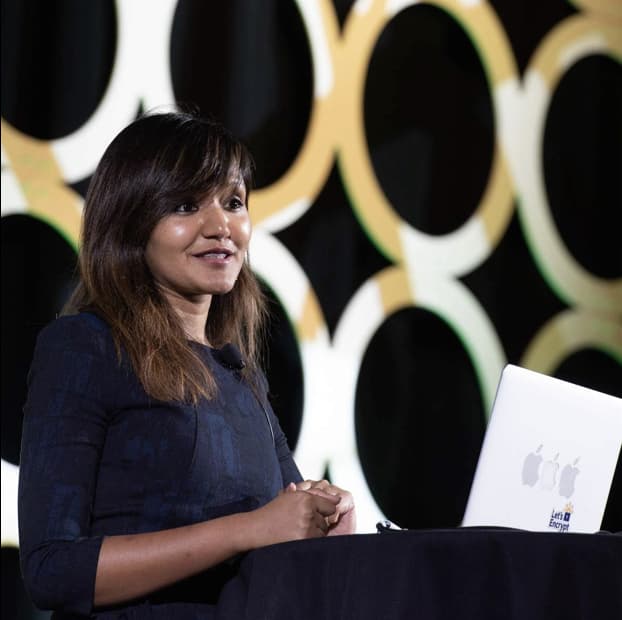
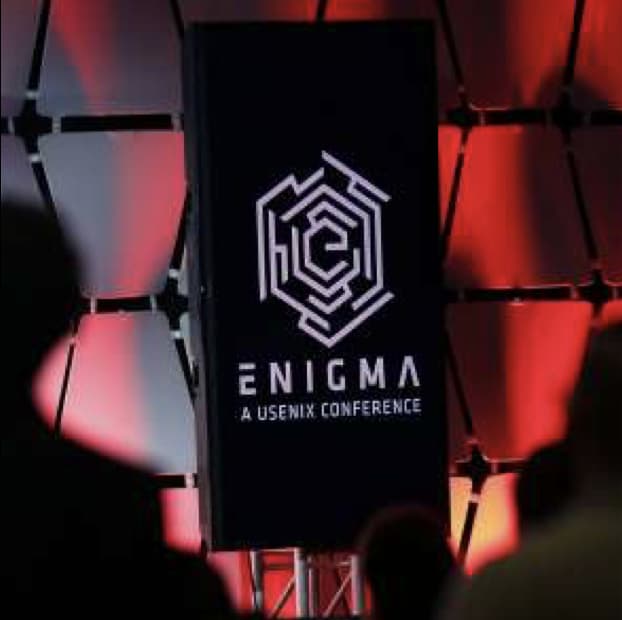
Conferences
Find out more about upcoming USENIX conferences, as well as events that are being held in cooperation with USENIX.
Publications
20,000+ pieces of conference content such as videos and refereed papers. And growing. All free. Brought to you by USENIX, thanks to our open access policy.