

Accurate performance testing of heterogeneous distributed systems, such as those created using GRID technology, requires a consistent method for retrieving system performance data from multiple platforms. This paper presents CAMP [Note 1]: a low-level platform independent performance data API designed for use with distributed testing frameworks.
CAMP is not necessarily tied to the distributed testing task: it provides a simple, low-level interface into operating system performance data that can be used to build complex performance measurement applications. This paper discusses CAMP's functionality and implementation in detail. It also contains a detailed analysis of the API's correctness, performance, and overhead.
Performance testing is a critical part of the distributed system development cycle, and there is a clear need for robust, automated, and reusable testing mechanisms. This task is made difficult by several factors, and each must be individually addressed and resolved for a system to be generally applicable to an appreciable portion of the set of distributed systems.
Test beds often consist of heterogeneous systems composed of different platforms and capabilities. For purpose-built systems, this can be intentional. However, for some system developers, this type of test bed may be the only resource available. For GRID-based systems, this is inevitable.
With the increasing popularity of Java and other virtual machine or interpreter driven languages, application code is often made "incidentally portable;" that is, the final system does not necessarily need cross-platform capabilities, but it gains that ability through the features of the host language. This provides a unique opportunity for distributed system developers to test code on expanded sets of test beds, including the previously mentioned heterogeneous systems. For developers to exploit this advantage, a performance testing framework must be able to operate seamlessly and transparently on several platforms, and it must not provide a burden to developers who are developing otherwise platform-independent code.
Aside from platform independence, a testing framework should be able to measure data that is both relevant and meaningful. Unfortunately, distributed metrics are difficult to generalize. For example, developers of distributed agent systems might be concerned with end-to-end processing time of requests, while a developer of a distributed computation system might be interested in the efficient and total utilization of available network resources. However, certain metrics do lend themselves to standardization: system performance counters on individual nodes. A platform-independent method of accessing performance data on individual nodes could serve to supplement or even build larger, domain-specific metrics.
The source of system performance data varies. Some solutions make use of highly accurate hardware performance counters [21], which are dependent on the underlying architecture of the tested systems. In addition, the interfaces to these hardware systems usually require extension of the host operating system, making the framework doubly dependent on both the operating system and the underlying architecture. While this provides very accurate data for specific systems on a system-wide level, it is difficult to extrapolate isolated data for a single process.
At a higher level, modern operating systems provide interfaces to performance data, both on the system-wide and per-process levels. These interfaces can take the form of a well-defined API, a high-level system of performance counting, or simply exposed kernel structures that contain performance information. Operating system performance interfaces often make use of hardware performance counters as well, further strengthening their accuracy. In addition, several operating system-dependent metrics are of use to the distributed system developer. These can include virtual memory usage, page fault counting, and network interface statistics.
This paper introduces CAMP: a cross-platform low-level API for measuring system performance, designed for use with distributed testing frameworks. CAMP is grounded on a single proposition: modern operating systems function similarly, and they keep track of their performance data in some externally-accessible way. CAMP standardizes access to this data through a cross-platform interface, fully encapsulating the available operating system performance reporting services. It is implemented across three major platforms in Python, a platform-independent interpreted language. The API and its respective semantics are identical across each platform. While not a testing framework in itself, CAMPmakes a valuable contribution to the task by solving the system data independence problem at the lowest level.
CAMP provides a common entry point and retrieval format for system-wide and per-process performance data. It is implemented completely statically, holding no persistent state. It attempts to provide raw, unprocessed data wherever possible. The implementation is substantial, production-ready, and uses the highest-performing, lowest-overhead method available on each platform to provide data. CAMP provides novel solutions to several implementation-specific problems. These include addressing a process consistently across multiple operating systems, encapsulating time-averaged data in a single, stateless function call, and addressing locally-named devices in a platform independent manner.
CAMP is a versatile interface: it aims to be the foundation of a performance measurement system and can be used as is or easily extended. It is usable in a variety of different scenarios.
The data provided by CAMP is raw in nature; that is, it has no meaningful calculation performed on it. For example, network connections are measured by total numbers of packets sent and received rather than a rate. CAMP's ability to provide this low-level data across multiple platforms allows developers to create platform independent secondary functions.
01 # Calculate the current transfer rate (Both
02 # in and out) for the given network adapter.
03 def BulkByteTransferRate(adapter):
05     # Query CAMP for the initial state.
06     initial = GetNetBytesSent(adapter)
07     initial += GetNetBytesRecvd(adapter)
09     time.sleep(SAMPLE_INTERVAL)
11     # Query CAMP for the final state.
12     final = GetNetBytesSent(adapter)
13     final += GetNetBytesRecvd(adapter)
15     return (final - initial)/SAMPLE_INTERVAL
For example, a developer needing rate or throughput data for network connections is free to implement the function in any way: her or she can choose how the state is stored, what statistical functions will be used to determine the rate, and how often the system will be polled. The developer is guaranteed reliable and consistent raw data from the CAMP interface. This extension would not be tied to a specific platform. By selectively determining what extra processing and state are used, the developer minimizes the overhead of the performance measuring system. A sample rate function appears in Figure 1.
CAMP could also be used in a wide scale client-server monitoring system. The API's versatility and consistency would allow implementation of a variety of cross-platform monitoring systems. System analysts might be interested in passive performance logging systems, where CAMP's data could be used to make decisions about expanding capacity or more efficient allocation of resources. System administrators could find derived functionality like active throughput and capacity meters useful: spikes or drops in measured data could quickly indicate problems.
Using CAMP all of these systems could be built with little knowledge of the inner workings of the tested systems' kernels. The simplistic model and implementation in a clear, scripting-like language allows non-developers to intuitively collect desired performance data.
Accurate operating system performance data would be a valuable addition to an existing distributed testing framework, and CAMP would be able to provide this functionality with minimal overhead. Many existing testing frameworks rely on the distribution of timestamped, domain-specific performance data [7, 11, 18]. In this scenario, timestamped data from CAMP or CAMPderived functions could be collected along with the existing data and correlated by time. This could provide powerful insight for the diagnosis of performance problems observed on a global level: developers could precisely quantify their software's effect on various operating system services during periods of poor performance.
Other systems concern themselves with treating distributed systems as black boxes [1]. These systems test only externally measurable values like global latency and throughput of provided services. CAMP provides a low overhead, non-intrusive way of supplementing this domain-specific data with system performance data. The API allows developers to maintain this black box model by utilizing the available operating systems to probe processes externally rather than instrumenting the running code.
| Global Functions | |
| GetPercentProcessorTime(cpu) | Global CPU usage. CPU parameter may be omitted. |
| GetFreePhysicalMemory() | Global free physical memory |
| Network Functions | |
| GetNetBytesSent(interface) | Total bytes sent on interface |
| GetNetPacketsSent(interface) | Total packets sent on interface |
| GetNetBytesRecvd(interface) | Total bytes received on interface |
| GetNetPacketsRecvd(interface) | Total packets received on interface |
| Disk IO | |
| GetNumReads_Disk(disk) | Number of read operations on the given disk |
| GetNumWrites_Disk(disk) | Number of write operations on the given disk |
| GetNumReads_Partition(partition) | Number of read operations on the given partition |
| GetNumWrites_Partition(partition) | Number of write operations on the given partition |
| Per-process Functions | |
| GetNumPageFaults(process) | Number of major and minor page faults |
| GetCPUTime_Total(process) | Process CPU utilization |
| GetCPUTime_User(process) | Process user mode CPU utilization |
| GetCPUTime_Kernel(process) | Process privileged mode CPU utilization |
| GetWorkingSetKb(process) | Size of the process working set in KB |
| GetVMSizeKb(process) | Size of the used virtual address space in KB |
| GetThreadCount(process) | Number of threads contained in this process |
| Enumeration Functions | |
| EnumDiskPartitions() | Enumerates the available disk partitions |
| EnumPhysicalDisks() | Enumerates the available physical disks |
| EnumNetworkInterfaces() | Enumerates the valid inputs to the network functions |
| GetCPUCount() | Returns the number of CPUs in the system |
| GetProcessIdentifier(pid) | Returns a "process identifier" for the given pid |
| GetProcessIdentifiers(name) | Returns a "process identifier" for each running process launched from an executable of the given name |
| All CPU-time functions have an optional second parameter: the sample interval. | |
The architecture of a performance test can vary across different project domains, and it can evolve as a single project grows over time. Because of this, the architecture must be flexible; that is, it must be applicable to any of the aforementioned scenarios. To accomplish this, the interface must be created at the lowest level possible. Figure 2 shows the CAMP API in relation to the surrounding implementation levels.
| Performance measuring applications, testing frameworks | |||
| Possible CAMP extensions: derived functions, stateful counters | |||
| CAMP Low-level, stateless performance functions | |||
| Linux(proc) | Win32(pdh) | Solaris(kstat) | Other |
CAMP's design uses a simple, low-level stateless interface. To the user, all performance data can be thought of as existing in a set of permanent counters, and the API merely provides simple accessors to the data. The API is a set of solid, well-tested building blocks that form the foundation of a platform-independent performance monitoring application.
The design is largely inspired by declarative languages like SQL. The data is assumed to exist in a changing but directly inaccessible state, and the methods for accessing the data are thread-safe and consistent for a single point in time. CAMP focuses on providing the simplest, most intuitive interface without prematurely optimizing it by forcing it into the mold that best suits the performance data access patterns of a particular platform. As discussed in our empirical evaluation, this does take a toll on performance in some cases. The simple, atomic request-response architecture allows a focus on correctness and usability: CAMP defines distinct function contracts, and its proper use is not defined by a set of unnecessarily complex access patterns.
For CAMP to be complete, it should be able to provide substantial coverage of each implemented platform's performance statistics. This presents several challenges: some platforms provide more information than others, while some platforms simply provide different information or different levels of granularity.
CAMP makes use of a lowest common denominator design. This approach, described in [5], is taken by the Java Abstract Windowing Toolkit (AWT) [22]. The Java AWT takes the intersection of natively- available GUI components on several platforms and generalizes them under a single interface. While effective, this method does limit the functionality to that of the least functional platform. However, it is guaranteed to be fully consistent in any implementation.
While this intersection design has the potential to severely limit functionality, CAMP is still able to provide a comprehensive API. As discussed previously, CAMP is based on the postulation that modern operating systems function similarly and record similar data. While this data may be difficult to access, the common set of accessible data was more than enough to provide a usable API. The current API appears in Figure 3.
CAMP is designed to be "as fast as possible," and this involves the elimination of some design alternatives - namely, the ability to leverage preexisting native utilities to shorten CAMP's development time. Most [Note 2] of CAMP's functionality can be collected from the output of a native, command line driven utility on the host. However, this is a potentially costly layer of indirection: the forking of a process to satisfy a single function call, which may be called several times per second, puts an unnecessary strain on operating system resources and is very time consuming.
This overhead may be acceptable for simple system monitoring tasks, as demonstrated by Eddie [12], but this level of resource consumption is not satisfactory for a high-performance API that intends to form a foundation for performance measuring applications. Instead, CAMP makes use of the fastest, most direct native interfaces into the kernel performance data for each implemented platform. It does not make use of any other utilities or services.
CAMP's public interface is implemented in the Python language, and its internals consist of a mix of Python and native code. It currently supports the Win32 (Windows NT/2000/XP), Linux 2.6, and Solaris (SunOS kernel 5.x) platforms. The Win32 implementation interfaces to Microsoft's performance data handler (PDH) interface. In the Linux implementation, CAMP interfaces with the proc filesystem. On Solaris, CAMP uses both the proc filesystem and the kernel statistics chain (kstat).
This chapter discusses each platform's implementation in detail, and it also chronicles several global issues that affected all platforms.
Python is an open source, interpreted language that is available for most modern platforms. It is characterized by its unusually clear syntax and strong set of libraries. Python lacks end-of-statement delimiters, forced declaration of variables, and explicit types. It also uses the concept of "significant white space," with indentation actually indicating the nesting level of a particular statement. These features lend to Python code's readability. Python combines the simplistic syntax and excellent text processing capabilities of a scripting language with the robustness and maturity of a full, heavyweight programming language.
CAMP uses Python for a number of reasons. Python has a fully wrapped interface to the Win32 interface using the pywin32 package. This included a wrapper around Microsoft's performance data handler interface, which was able to provide nearly all performance measuring functionality in the Win32 implementation. Python is also ideal for text processing tasks. Containing a full regular expression matching and replacement implementation, Python lessened the difficulty of parsing the cryptic output of the proc filesystem.
Microsoft does provide a low-level interface to performance information: the HKEY_PERFORMANCE_ DATA registry branch. However, it is not visible to the user and requires direct programmatic interaction with the registry hive. When using the registry directly, access is not error-checked or thread safe. Incorrect use may provide false data rather than an exception or error. Instead of accessing this data directly, Microsoft recommends the use of the performance data handler interface.
The Win32 performance data handler interface is a high-level encapsulation around the concept of performance data gathering. It revolves around the concept of a "counter," which is an object that is attached to particular performance "concept" and can be called to periodically gather data about that concept. To retrieve data, the user calls either a raw or formatted data retrieval function on the counter. The Windows "Performance" control panel administrative tool demonstrates the direct use of this interface.
Windows provides counters for performance "objects." Examples of objects include "Memory," "Processor," "Paging File," and "Physical Disk." Each object is associated with one or more "counters." For example, the "Memory" performance object contains around twenty counters, including instances such as "Pages/sec," "Available Bytes," and "% Committed Bytes in Use."
Some counters are associated with "formatted" data, which involves a computation on raw data. "Pages/sec" is an example of one of these: the counter itself contains a raw count of the number of pages written to and read from disk, but retrieving the counter value causes an average rate to be calculated. One can bypass this calculation by retrieving the "raw" performance data from a counter. Other, scalar counters like "Available Bytes" return the same value for both formatted and raw outputs. CAMP almost exclusively uses the raw data, which may have its ultimate source in the NT kernel (in the case of process information) or in an individual device driver (in the case of network or disk IO).
A counter can optionally be associated with an "instance." For the counters in the object "Process," the set of instances consists of the set of running processes. For the counter "Network Interface," the set of instances consists of the set of installed network adapters. Microsoft provides a function to enumerate the set of instances for a given counter, which CAMP uses to implement each of the enumeration functions.
The Microsoft performance data handler interface is designed for higher-level usage than that provided by CAMP, but there appears to be little overhead in using its clear, relatively simple interface.
On the Linux platform, CAMP collects operating system performance data through the proc pseudo-filesystem. proc is a file-like interface to kernel data structures that show system information, which includes performance data. At the top level, the filesystem contains three types of entries: status files, kernel-specific directories, and process directories [Note 3]. The proc filesystem is referred to as a pseudo- filesystem because the "files" presented are actually file-like interfaces into kernel data structures which reside completely in memory or are generated dynamically. As a result, access to the filesystem is exceptionally fast. Several files are redundant: human- readable versions are supplemented by simple, one-line white space delimited versions that can be parsed more quickly.
The status files contain useful information about the system configuration: information about the CPU, mounted filesystem, attached devices, and memory. It also contains an accurate uptime count, which lists the current system uptime and how much of that time has been spent in the idle process.
The kernel-specific directories are groupings of status files. For example, the net directory contains information about each protocol in use as well as raw performance data for each network adapter. In addition, when granted root-level access, several of these files are writable. Modifying one of these "files" causes the modification of the related kernel data structure.
CAMP uses these kernel-specific files for implementing all global functions. In many cases, the data provided by proc is already in a sufficient format. In some cases, however, the data requires manipulation. For example, most memory measurements in Linux are stored as page counts. CAMP converts these to a raw size by adjusting the value based on the results of the POSIX getpagesize call.
The process directories contain useful information about each running process. They are named by the process identification number (pid) of the related process. A process directory contains a symbolic link to the executable that spawned the running process, information about memory and CPU usage, a list of open file descriptors, and varied information about the process's environment.
The information provided by proc fit well into the CAMP interface. It is relatively low-level, accurate, and can be accessed with little overhead.
Performance data on Solaris comes from two sources: the proc filesystem and the kernel statistics chain (kstat). The Solaris proc filesystem differs greatly from the Linux implementation, following a more standard UNIX pattern. It exports performance data only for processes, not system-wide statistics, and the files contain binary data that must be read within a C-compatible language and cast to the appropriate struct type. This effectively precluded direct access from Python. To solve this problem, CAMP uses its own C to Python shared library that handles all data retrieval, marshaling, and error checking. Once again, reads on the proc files are atomic and unbuffered to prevent data inconsistency.
Global system data comes from a large data structure within the SunOS kernel called the kstat chain. The data structure consists of a linked list of performance counters, each of which can be one of several types: a set of name/value pairs, a binary C structure, or an undefined "raw" type. The data is categorized hierarchically by "class," "module," instance number, and name, but this organization is not reflected structurally; that is, no matter what the search criteria, finding an appropriate kstat instance is always an O(n) operation.
A research-quality implementation of a Python to kstat bridge already existed [2], but it was not compatible with the current version of the SunOS kernel and it was incapable of retrieving many of the P "kstat" instances that CAMP needed. Building on this system, CAMP generalized the solution to all instances and introduced compatibility with modern kernels. CAMP's version of the library also includes a faster search algorithm: the original author made several passes of the chain when one would suffice. This library also includes several bug and data type conversion fixes, and it also adds the ability to produce enumerations of all statistics structures of a certain class or module.
With these enhancements, all global and enumeration functions were able to be implemented with a relatively simple interface. As in the Linux implementation, memory data in page units had to be converted to a byte count.
This section presents selected implementation issues and their respective solutions.
The pywin32 package that encapsulated the Windows performance data handler interface was incomplete. The existence of the "raw" retrieval function was not implemented in the Python wrapper DLL, and its existence was not acknowledged or documented.
CAMP includes an extended version of the pywin32 interface that includes this missing functionality. CAMP uses Microsoft's documentation and header files as a strict contract for converting the raw native values into appropriately typed Python objects, taking special care to avoid narrowing conversions that may cause loss of data.
Determining CPU usage from a single function call posed a unique problem. At any instant in time, the usage of a CPU in a time-shared operating system is either zero or one hundred percent. Introducing a persistent polling thread into the system was not a viable option; it would violate the design goals of the interface.
To solve this problem, the CPU functions query the current idle and uptime counters immediately, block for a specified interval, and query a second time and return. This causes no additional performance overhead: the task can be unscheduled while blocked, and there is no thread-spawning overhead. The sample rate is configurable at call time by applying an optional second parameter to the call indicating the block interval. This value is set at 100 ms by default, and has proved to be very accurate while keeping the function responsive.
The utilization is calculated as:

Another issue arose with multi-CPU systems. CAMP should provide the ability to distinguish load on a single CPU from global system load, so the global CPU measuring function allows an optional CPU parameter: a 0-based index that requests the load for a specific CPU. Omission of the parameter causes the total system load to be returned. CAMP also provides a CPU count function to provide information when the count is not known.
The networking and disk functions must operate on a per-interface and per-disk or partition level to be useful. However, device names are certainly not consistent across systems, and indexes, while consistent, are arbitrary and not meaningful.
One solution would be to use common device names to reference the devices. The logical candidate for this would be to map Linux's standard eth* hd/sd naming scheme into Windows. However, this would provide an unnecessary burden and layer of confusion for Windows developers. In addition, the mapping of English device names to a universal "code" could prove to be nondeterministic, forcing developers to use empirical tests to determine what "code" referenced the relevant network adapter or disk.
CAMP's solution is to use enumeration functions. In this particular context, the function enumerates the list of installed network adapters and the list of installed disks. However, the semantics of the function is stronger than it appears on the surface. Every output of the enumeration function is guaranteed to be a valid input to the performance measurement functions; this means that the output will not only contain the correct name, but it will also be in the correct format required by the underlying platform.
The Windows build of CAMP uses Microsoft's PDH object enumeration function. On Linux, this was implemented by parsing a file in the proc filesystem and building a tuple of the results. On Solaris, this data is gathered over one traversal of the kstat chain.
The standard method of addressing a function in an operating system is the process identifier, or pid. However, Windows does not have an O(1) method for programmatically accessing a process's performance counter based on its pid; one must enumerate all processes and look for a match. This would be an unreasonable solution for CAMP: because the API does not maintain a state, each call to a per-process function would take O(n) on a Windows machine (where n is the number of currently running processes).
On Linux and Solaris, the opposite is true. Getting process information by pid is achievable in O(1) time, but finding a set of pids from a name is an O(n) operation.
CAMP's solution to this is to introduce an abstract concept: the "Process Identifier." The developer can retrieve a process identifier through a CAMP function that takes a pid as its input. Because this function ideally only runs once per session of use, the O(n) running time is acceptable.
On the Windows side, this function is implemented by enumerating all current processes and finding the matching process. CAMP then creates a process identifier, which, on this platform is a string, according to Microsoft's naming conventions. The identifier consists of the name of the executable binary with its extension truncated, and an increasing numeral appended for processes spawned from the same binary. CAMP returns an error value if the process is not found.
The Linux and Solaris functions are much simpler: they merely attempt to open the process's status file from its proc directory. If it fails for any reason (existence of the process or lack of permissions), an error value is returned.
CAMP does not attempt to hide the value of a process identifier in an abstract class. If a developer is aware of the identifier type for the current platform, he or she can bypass the process identifier step.
For convenience, CAMP also provides a function that returns a list of process identifiers given an executable file name. This function returns a list because multiple processes can be running from the same executable - which may often be the case in a distributed system. For example, the prefork variant of the Apache web server creates multiple processes to handle child requests. A developer can simply run GetProcessIdentifiers(`httpd') to get an enumerable list of all running Apache processes.
The objective of the result validation phase was to ensure that each performance function reports reasonable and predictable behavior under the presence of controlled conditions. CAMP's test plan involves running the performance monitoring functions against small programs that use a specific resource in a measurable amount.
Correct implementations of these programs would require kernel augmentation on all three platforms, as the operating system is inherently in control of the distribution of resources. In spite of this, our programs were able to provide a reasonable approximation for CPU, memory, network, and thread usage.
The test bed consisted of a high-end PC [Note 4] running VMWare workstation. Each test ran sequentially on three virtual machines: Microsoft Windows 2000 Professional (kernel 5.0), SuSe Linux 9.3 (kernel 2.6.11), and Sun Solaris 10 (kernel 5.10). Each operating system ran only its essential services to minimize interference with tests. The virtual machine configuration limited each to 256 MB of RAM and a 32-bit virtual processor.
To test the various processor time functions, CAMP was set to monitor a simple Python program that generates a fixed load on a single CPU. Put simply, this program divides a discrete interval into an "on time" and and "off time" based on the desired load, and alternates between busywaiting during the "on time" and sleeping during the "off time." The code for this function appears in Figure 4.
01 def waste(amount):
02    on_time = _INTERVAL*(amount/100.0)
03    off_time = _INTERVAL-on_time
04    ctime = clock()
05    while True:
06       if clock() - ctime >= on_time:
07          sleep(off_time)
08          ctime = clock()
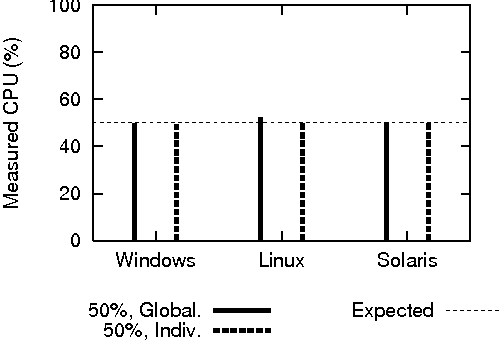
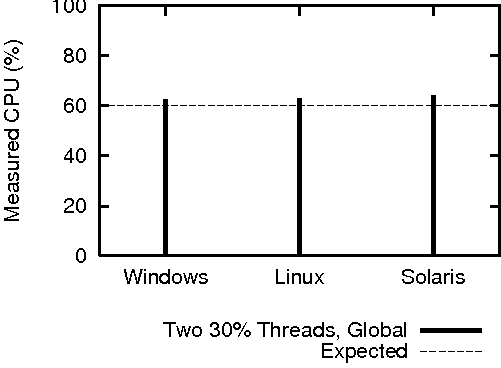
The global CPU time function and the per-process equivalents were first individually tested against idle, 50% and full system loads. Next, both functions were tested against two processes, each consuming approximately 30% of the CPU. The optional "sample rate" parameter was omitted, leaving a default sampling period of 100 ms.
All reported values are averages of 200 samples taken at a 0.5 second interval. Each average is the center of a 95% confidence interval on the mean, given that the overall sample distribution is normal. The algorithm used is described in [10]. The range of each confidence interval never exceeded 0.5% and does not cause a visible difference on the scaled graphs.
| Before Alloc. | After Alloc. | Difference | |
| Work. Set Size | 9132 | 10120 | 988 |
| Phys. Free | 416244 | 415272 | (972) |
| (a) Windows | |||
| Before Alloc. | After Alloc. | Difference | |
| Work. Set Size | 14128 | 15112 | 984 |
| Phys. Free | 10196 | 9324 | (872) |
| (b) Linux | |||
| Before Alloc. | After Alloc. | Difference | |
| Work. Set Size | 13096 | 14084 | 988 |
| Phys. Free | 387440 | 386472 | (968) |
| (c) Solaris | |||
The results of these tests on appear in Figure 5. All platforms reported the idle and full loads without error, and each platform was able to provide accurate results for all other intermediate loads. The global measurement of the two-process test read slightly above the expected value; this is most likely due to scheduling overhead.
 |
 |
 | |
The memory usage tests operated on the functions GetWorkingSetKb and GetFreePhysicalMemory. The test program is a simple, two-stage Java program. It first launches and immediately allocates a 976 KB array on the heap and waits. Upon continuing, it allocates another 976 KB array and waits until terminated. Table 1 lists the results of the two CAMP functions before and after the allocation on all three platforms.
CAMP reported consistent working set results for the program on all three platforms, albeit with a 4KB disparity on Linux. The Linux virtual machine's page size is 4KB, so this represents a reasonable difference of just a single page.
However, while the working set function reported consistent results, it did not report the 976 KB allocation precisely. Because Java programs run in a virtual machine that handles allocations on behalf of the running code, precise changes in memory usage, from a program perspective, are not necessarily exactly reflected at the physical level. In practice, however, the difference between the expected and actual values was just over 1% when using these short- lived test programs. This was sufficient for verification.
The free physical memory validation was somewhat more informal. A precise test for this function is impossible to execute in user space as the full working sets of all tested kernels seldom converge on a completely steady state. This is due in part to each operating system dynamically controlling paging and various caches through periodically-running background threads. Instead of a precise test, this measurement was a verification that this function reasonably reflected the expected changes in free physical pages. In all cases, CAMP's free memory function reported a value within 10% of the expected result.
CAMP's network functions report the cumulative bytes and packets sent and received on a single interface. To verify these values, the functions were run against a Java program that sent and received a fixed number of packets and terminated. Each test packet consisted of a plain, addressed UDP packet with a 32 byte payload. UDP traffic was ideal for this test because it allowed a precise prediction of the number of packets sent and received; there was no extraneous ACK or connection setup overhead to skew the results. Testing occurred on a private network consisting of only the CAMPtested virtual machines and their host.
Table 2 shows the results of this test. All platforms reported identical packet counts, but Windows reported a different bytes received count. The offending byte count was 600,000, which amounts to 60 bytes per packet. All other byte counts were 740,000, or 74 bytes per packet, which gives a difference of 14 bytes per packet. Several more tests with increased packet sizes showed that this discrepancy always remained at exactly 14 bytes per packet.
| Before Send | After Send | Difference | |
| Packets Sent | 37412 | 47412 | 10000 |
| Bytes Sent | 2175911 | 2915911 | 740000 |
| Packets Received | 58299 | 68299 | 10000 |
| Bytes Received | 13001375 | 13601375 | 600000 |
| (a) Windows | |||
| Before Send | After Send | Difference | |
| Packets Sent | 60968 | 70968 | 10000 |
| Bytes Sent | 4157951 | 4897951 | 740000 |
| Packets Received | 112454 | 122454 | 10000 |
| Bytes Received | 154652907 | 155392907 | 740000 |
| (b) Linux | |||
| Before Send | After Send | Difference | |
| Packets Sent | 1762 | 11762 | 10000 |
| Bytes Sent | 160145 | 900145 | 740000 |
| Packets Received | 3379 | 13379 | 10000 |
| Bytes Received | 386700 | 1126700 | 740000 |
| (c) Solaris | |||
The composition of each 74 byte packet is likely 14 bytes of Ethernet header, 28 bytes of UDP overhead, and the 32 bytes of payload. A likely explanation for the 14 byte difference is that the network driver for the virtual machine's network adapter is not adding the Ethernet header to its incoming byte counter. CAMP's network functions reflect this discrepancy because the byte counts come directly from the respective network drivers. Informal tests on non- virtual Windows machines did not show this same asymmetry.
Despite this difference, the key metrics for evaluation were the packet count and the verification that the byte counts were incremented by at least 320,000 bytes (payload × packet count). In addition, the test programs verified that the payload was delivered in full.
Verifying the thread count function was a straightforward task. The function GetThreadCount recorded the current thread count of a Java program running one extra thread. After a fixed amount of time, the program spawned a second thread. The thread count was recorded once again. The results of this test appear in Table 3. CAMP recorded the proper increase in thread count on each platform.
| Before | After | ||
| launch | launch | Difference | |
| Windows | 9 | 10 | 1 |
| Linux | 9 | 10 | 1 |
| Solaris | 9 | 10 | 1 |
This test could have been potentially incorrect. The Java Language Specification does not guarantee that each conceptual thread is backed with a native thread. However, in practice, the Sun-provided HotSpot virtual machine implementation behaves in this manner on all three platforms. Surprisingly, each platform showed the exact same thread count - which would suggest that the virtual machines are structurally similar.
The previous sections contain strictly quantified test results that confirmed CAMP's functionality. However, they were not comprehensive - they had no reference to the enumeration functions, the disk IO functions, or the page fault count. Due to the difficulty in generating predictable results, these functions were part of an informal test plan.
The disk IO functions are difficult to test consistently. The disk IO data provided by CAMP comes directly from the respective disk drivers, so this data does not reflect an operating system-level layer of abstraction. There is no direct relationship between a user-level read or write and an actual physical disk action. For this reason, the disk functions were verified informally. On all platforms, the counters were integral, increasing, and strictly monotonic. They also increased their respective rates of increase during periods of high disk activity, making them suitable for a derived rate function.
The page fault function was also difficult to test. Instead of a direct analysis, CAMP's output was verified to match that of a comparable native utility on each platform.
On Windows, Microsoft provides an optional utility in the Windows Resource Kit called pstat, which provides a crude version of UNIX ps. This utility was able to provide a page fault count for comparison. On Linux, the standard ps command is able to provide a page fault count with the switch -O min_flt,maj_flt. Sun does not provide a utility with Solaris 10 to access the page fault count of a single process. However, a comparable utility, pio [9], was able to provide the needed data to verify CAMP's function.
The values returned by the enumeration functions are by definition platform and system-dependent, making them impossible to test quantitatively. Instead, the functions were tested informally on an expanded test bed, which included a 64-bit Linux production server, two quad-processor 64-bit Solaris servers, a Windows XP x64 desktop, and the three original virtual machines.
Testing the enumeration functions involved manually collecting a list of required results in a platform-dependent manner. On all six test systems, the CPU count was known beforehand and simple to verify. On Windows, correct values for the network, disk, and partition enumeration functions are available in the "Device Manager" administrative tool.
On Solaris and Linux, the command netstat -i provided a correct list of network interfaces suitable for comparison. Disk and partition lists were available as symbolic links in the device node directories. This information was available in /dev/disk/by-id/ and /dev/dsk on Linux and Solaris, respectively.
This section details the tests used to measure the API's execution speed and overhead. The first set of tests precisely measured execution speed and CPU usage distribution throughout the implementation components. The second test measured the overhead of a simple CAMP-based monitoring program on a running system. The final test measured the impact of the same monitoring program on a production web server using externally-derived statistics.
This section contains a low-level, direct measurement of CAMP's performance overhead. Python provides a timing package, timeit, which takes a small snippet of code as an input and aggregates several iterations of it into a single execution unit. timeit then runs that larger unit several times, timing it using the highest resolution clock available on the host platform.
Timing runs consisted of a total of 30,000 runs per function: three separate execution runs of 10,000 invocations. To measure the overhead of the CPU functions in their purest form, the sample rate was set to zero to eliminate the normal blocking.
For brevity, each "execution unit" comprised groups of similarly implemented functions rather than individual calls. For a function to be "similarly implemented," it must access the same class of performance data. A trial run on all individual functions confirmed that the grouped functions had near-identical execution times.
Figure 6 displays the results of these timing runs. All CAMP functions executed quickly, with the slowest function still allowing for over 100 invocations per second.
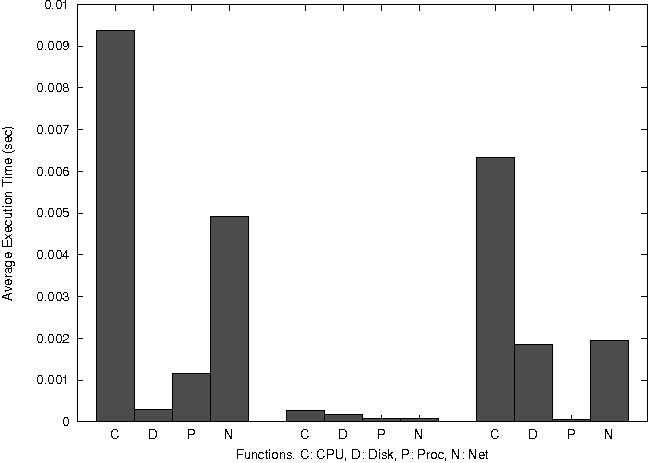
The Linux functions all executed at an order of magnitude faster than the Solaris or Windows counterparts. The Windows functions all displayed relatively significant overhead, but the disk counters were surprisingly fast to access. The Solaris functions behaved as expected: The disk and network functions both executed in around the same amount of time as they both traverse the same chain for their target data, while the CPU functions must traverse the chain twice and perform some calculations. Solaris per-process functions make use of the proc filesystem, so execution time is comparable to that of Linux.
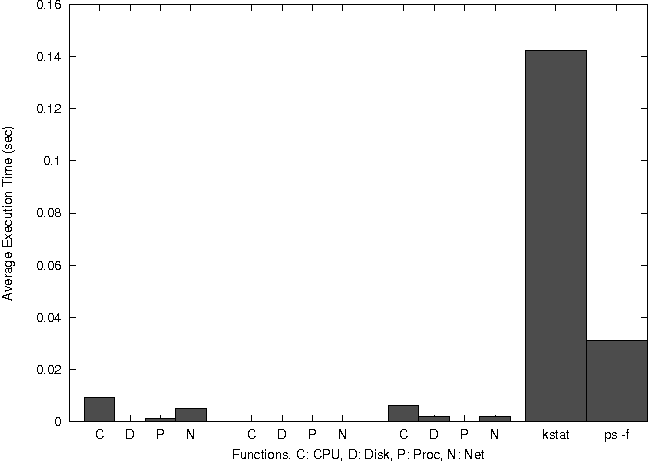
To put these execution times in perspective, Figure 7 contains the same information as Figure 6, but the graph has been scaled against the execution time of running a native process within Python. As discussed previously, this is an approach taken by other utilities and was an implementation alternative for CAMP. On Linux, the timing includes forking a second process, executing the command ps -f, and collecting its output. On Solaris, the timing performed a similar action using the kstat command line utility. No such command line utility is built in to Windows. [Note 5] CAMP's native access of performance data clearly allows a much higher level of performance.
Next, we used CAMP to measure the overhead of a CAMP-derived monitoring program.
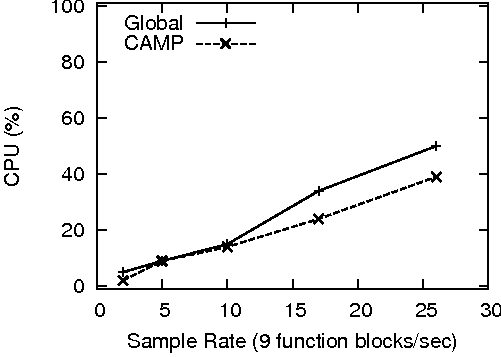
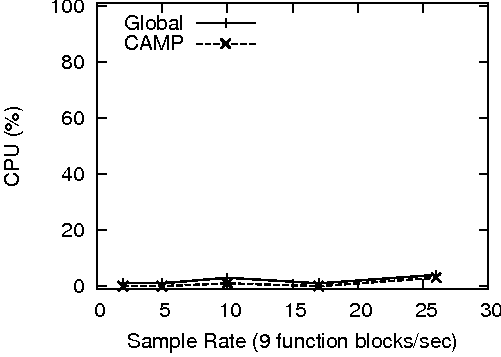
The first task involved a tunable monitoring program, probe. This program calls nine CAMP functions at a time, with the entire nine-function block being executed at a specific real-time sample interval. To implement the sampling frequency as accurately as possible, this monitoring program times the execution of the nine-function block at startup and adjusts the sleep interval accordingly.
The tests consisted of running probe at increasing sample rates and measuring the impact on the system at each level using another instance of probe. While the results of every CAMP function were included in the measurements, the only significant differences manifested themselves in the global and per- process CPU functions. However, this exercise did confirm that CAMP is indeed stateless and without memory or thread leaks on all implemented platforms. The results of this test on the three implemented platforms is shown in Figure 8. CPU values are an average of 20 samples taken over a 10 second period.
 |
 |
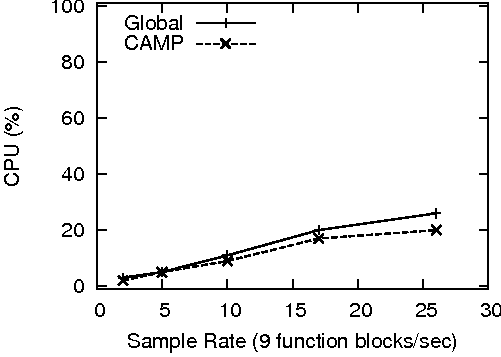 | |
These results were in line with the values recorded by the timing functions. On Solaris and Windows, CAMP produces little overhead up to 10 function blocks/second (90 functions/second). On Linux, CAMP produces little overhead at all measured sample rates.
The final performance test consisted of measuring CAMP's overhead from an externally accessible statistic. This test is important for several reasons. First, the results of the previous test could have been partially skewed by using CAMP to test itself - caches could have been kept artificially hot. Second, the concept of "CPU utilization" is a somewhat coarse statistic that does not always directly map to actual or perceived performance. Third, CAMP may cause performance impacts in the kernels of the respective platforms in a non-obvious way that may skew results. Lastly, it allows a complete distrust of the operating system-provided performance data.
For this experiment, the target application was a web server. Each virtual machine was configured with Apache 2.0.53. The Linux and UNIX machines used the prefork multiprocessing module (MPM), and the Windows machine used the default Windows NT MPM. Each Apache installation used the default MPM configuration parameters, including initial process and thread count.
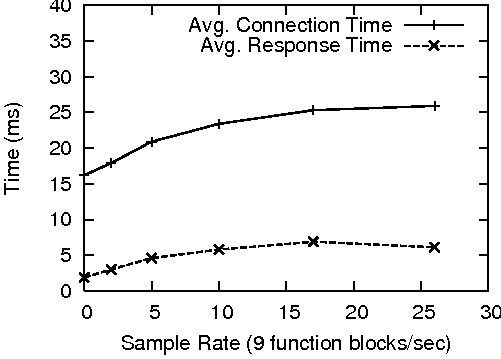
The test involved running the probe program from the previous test at the same sample intervals, but instead of recording system performance data on the server, Hewlett Packard httperf [13] collected http client response statistics from an external machine.
To generate a normal load, httperf created a total of 1400 connections to each web server at a rate of 40 connections/second. This rate produced an approximate 15% load on the Linux and Solaris machines and a 30% load on the Windows server. The results of this test are presented in Figure 9.
 |
 |
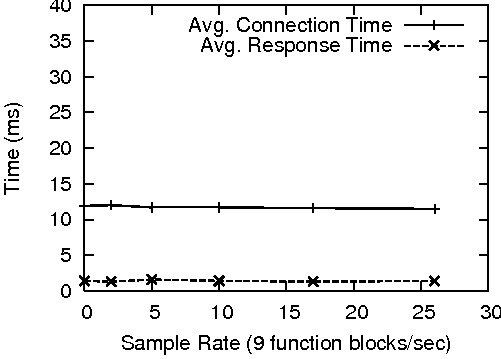 | |
CAMP only produced a measurable impact on the Windows server. It appeared to take a progressively increasing hit as probe's sample rate increased. CAMP did not affect the performance of the Solaris and Linux servers at this sample rate. This was somewhat unexpected, given that CAMP's performance on Solaris was comparable to its Windows performance. A likely explanation lies in the implementation of the Apache MPM on each platform. The Windows version of Apache handles all client connections from within a single, multi-hundred-threaded process. In terms of process scheduling, this lone process has the same weight and priority as probe. This causes CAMP's impact to be more pronounced, even at relatively low sample rates. On Solaris and Linux, Apache prefork responds to the increased load by forking additional processes, which causes the Apache system as a whole to be scheduled more often than probe.
CAMPmon is a simple Python application that demonstrates the use of the CAMP API. It monitors a selected group of networked workstations, each CAMP-supported, and records the global CPU and memory usage to a server console application.
The workstation client program is simple: it merely loads Python's lightweight XML-RPC server and registers the relevant CAMP functions as network-accessible. The server console program reads in an XML file with a list of accessible workstations and queries them at a specified quantum using the Python threading package. This data is then aggregated on the server console and displayed as formatted text.
Testing was performed across eight workstations: four booted into Fedora Linux and four booted into Windows XP. The server monitoring application was launched from a Windows workstation. The system performed as expected, continuously and accurately reporting each workstation's performance information.
This simple implementation is intended to be a proof-of-concept display of CAMP's potential. Only a single client application was used for both platforms, and the server was unaware of the underlying implementation on each workstation.
Two identical servers were configured with Windows 2000 Server and SUSE Linux 9.3 (kernel version 2.6), respectively. Apache 2.0.53 was loaded on each. The Windows server was configured to use the default NT MPM with 300 threads, and the Linux server was configured with the worker multi-processing module (MPM), also configured with 300 initial threads.
A Python script was written to monitor each server. At a half- second interval, it wrote a log file containing network traffic counts and aggregate process resource usage data about the collective Apache processes. This script was ran individually on both platforms.
A third server was configured with a build of Apache flood. Each server was tested with an identical configuration: 250 clients, connecting in groups of 10 at one second intervals. Figure 10 contains the results collected by CAMP.

The network functions graph shows that each server was given a comparable load. Each server both sent and received the same amount of data. The CPU utilization graph was not unusual; the IO-bound Apache process did not heavily tax the CPU on either platform.
The memory graphs, however, were more telling. The Linux build of Apache with the worker MPM was able to run in a much smaller footprint, and, more importantly, was able to respond to the increased load quickly and without a large increase in either its working set or frequency of page faults. The Linux server's working set rose a small amount at the instant the load test began and remained steady throughout, while the Windows server took nearly twenty seconds to reach a steady state. During those twenty seconds, the Windows server was constantly causing page faults. This performance discrepancy could have been caused by a combination of configuration differences and implementation variations in the platform-dependent Windows and Linux MPMs.
PAPI [3] is a system that shares several design goals with CAMP, but it accomplishes a slightly different task: it provides a platform- independent interface into hardware performance counters rather than operating system counters. On most desktop architectures, the underlying architecture is capable of providing controllable metrics about processor and low-level cache events. Each architecture has a different set of assembly instructions for accessing these counters, and each set has different semantics.
PAPI provides a platform independent interface to these counters through a standard C and FORTRAN interface, but it requires operating system kernel augmentation on most common platforms. PAPI does provide accurate metrics: its hardware counter interface has been used to validate other benchmarks [15].
Unlike CAMP, performance data provided by PAPI is difficult to correlate with a specific process. Utilities that allow this behavior either ignore the effects of scheduling or instrument the operating system kernels to report scheduling events [14].
Many system monitoring solutions are implemented using the SNMP protocol [23]. It provides a simple request/response protocol for system monitoring and management. SNMP is an application level protocol, implemented using UDP, that allows clients to host a set of named data. Examples of managed data include host name, uptime, and load. Because the protocol is at the application level, the local client implementation (the SNMP agent) is in full control of what data is reported and how it is obtained.
The latest version [17, 8] of the protocol provides bulk request/response functionality that scales more reliably with large distributed systems. When used with common object names, SNMP is capable of providing a common interface into operating system performance data by means of a common network packet. However, the SNMP agent that runs locally on the monitored machine and services requests must still be able to actually collect the system performance data, which in most cases must be accomplished with native code. CAMP can provide a simple method for implementing a platform- independent SNMP agent that provides performance data for a set of managed hosts.
The Gloperf system [11] is part of the Globus GRID computing toolkit [6]. By using the GRID framework, it is able to measure selected performance statistics in a platform independent manner. The client side of this system runs as a daemon, and it actively collects its own statistics rather than broadcasting operating system or network protocol statistics. It uses a sensor/collection model in which the user installs a "sensor" on the client to be probed and periodically collects data. CAMP follows a completely different model: it only reports data that is already available on the host.
The Tau [20] set of tools is a high performance computing testing framework that has been recently updated to collect full statistics from a Java Virtual Machine [19], introducing platform independence. This has been used to create a Java profiler that can selectively instrument and measure parallel and distributed Java applications. The tool's feature set is comprehensive, and its standard interface allows it to be used on a number of platforms. However, all measurement is confined to within the virtual machine - Tau cannot measure system- level statistics.
CoMon [16] is a monitoring layer for the PlanetLab testbed [4]. It collects data from individual PlanetLab distributed nodes, and its concept of a "node-centric daemon" can deliver nearly all of the performance data that CAMP would provide. However, this tool only works with the PlanetLab operating system (a modified version of Fedora Core Linux), which makes the research less useful for systems outside of that controlled domain.
CAMP's most important task is its continued implementation on other Python-supported platforms. Many UNIX-like operating systems are able to support both Python and the performance information necessary to support CAMP, including the newest Macintosh operating system.
There are endless possibilities for derived, second-layer functions. However, a standard set, including functions like rate calculators and aggregate network traffic, is feasible.
Distributed system performance testing is a broad problem, and CAMP seeks to solve the lowest level issue: CAMP allows developers to collect performance data from multiple platforms in a consistent, correct, and predictable manner.
CAMP can be obtained at: https://wiki.csc.calpoly.edu/camp.