We begin by evaluating the effect of varying load on the performance of our proposed algorithm and its alternatives. We consider a simple topology with a single bottleneck shared by many competing flows. The bottleneck bandwidth is 40 Mb/s and is shared by a hundred source-destination pairs. We model the bottleneck router as a FIFO drop-tail router for TCP and PCP flows. The buffering at the bottleneck is set to the bandwidth delay product. The round trip times for the source-destination pairs are uniformly distributed from 15 ms to 35 ms. We simulate fixed-length flows of 200 packets of size 1250 bytes each (resulting in an overall flow size of 250 KB). We vary the arrival rate of new flows to control the offered load to the system. The flow arrivals are randomized, using a Poisson arrival process, to avoid synchronization artifacts and to simulate varying load conditions, but the mean arrival rate is fixed based on the desired level of load.
The simulation parameters for this and the following experiments were chosen to be illustrative; they are not intended to be representative. For instance, instead of using a mixture of flow sizes as with real workloads, we typically use fixed size flows so that we can compare mean response times.
|
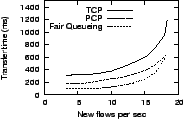
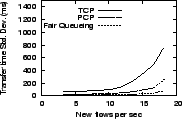
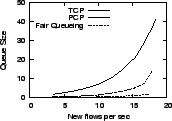
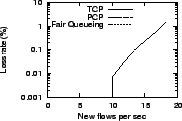
Figure 4 presents the variation in key performance characteristics as we increase the offered load from 15% to about 90% of bottleneck capacity. Since each flow offers 250 KB or 2 Mb of load, three new flows per second implies an offered load of 6 Mb/s or 15% of bottleneck capacity. We measure the response time to complete each transfer, including the cost of connection establishment. We also report the variability in response time (fairness), the queue size at the bottleneck, and the average loss rate at the bottleneck.
The results show that PCP has better response time than TCP and exhibits smaller variations in response time. PCP's response time is close to that of fair queueing. For low load conditions, PCP adds about two round-trip delays to fair queueing as it probes for available bandwidth before ramping up to the sending rate. At high load, PCP continues to perform well, ensuring that the bottleneck is kept busy; PCP keeps queues small while holding down average response time. Across the spectrum of load conditions, PCP keeps queue sizes lower than TCP, and has no packet loss even at high loads. Even at moderate loads, packet losses can dramatically penalize specific TCP flows [12]; PCP avoids this effect.