We now evaluate the performance of PCP under bursty settings, where the history information might potentially yield incorrect predictions. First, we repeat the experiment from the previous section using a mixture of flow lengths instead of fixed length flows. We retain the mean length of flow to be 250 KB, but vary flow lengths according to a Pareto distribution with shape 1.25. We also set inter-arrival times to follow a Pareto distribution with shape 1.2. These parameters model self-similar traffic observed in real traces. Figure 6 plots the results. PCP provides performance close to router-based control in this case.
|
|
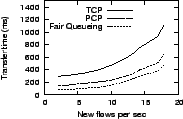
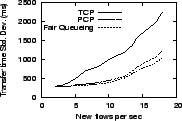
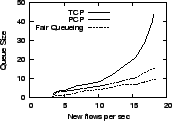
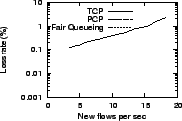
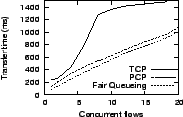
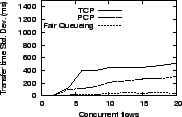
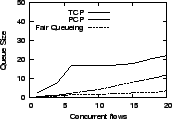
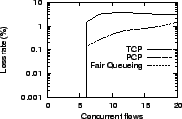
We next evaluate the different protocols when a number of concurrent flows are repeatedly started together resulting in synchronized transfers. In addition, we artificially rig PCP's history mechanism to always provide the estimate that all of the bottleneck bandwidth is available to each flow. By initiating multiple flows simultaneously with this estimate, we intend to evaluate PCP's performance when the history mechanism provides grossly inaccurate estimates. Figure 7 depicts the results as we vary the number of synchronized flows, each transferring 250 KB through our base configuration comprising of a 40 Mb/s bottleneck and 25 ms average RTT. Since the flow start times are synchronized, the TCP flows enter slow-start phase together. When the number of concurrent TCP flows is six or more, their combined ramp-up during slow-start results in filling up the router queue and causes a large number of packet losses. PCP also suffers from packet loss due to inaccurate history information, most of which occurs during the first RTT after transitioning to a high sending rate. But the sending rate is throttled in the subsequent round-trip as the PCP sender performs rate compensation in response to increased inter-packet gaps and one-way delays.