|
| |||||||||||||||||||||||||||||||||||||||||||||||||||

| ||||||||||||||||||||||||||||||||||||||||||||||||||||
|
USENIX '04 Paper
[USENIX '04 Technical Program]
Monkey See, Monkey Do: A Tool for
TCP Tracing and Replaying
|
| Yu-Chung Cheng1 | Urs Hölzle | Neal Cardwell | Stefan Savage |
Geoffrey M. Voelker |
| UCSD |
Google |
Google |
UCSD |
UCSD |
https://ramp.ucsd.edu/projects/monkey/
There are many factors that conspire to limit the performance of Internet Web sites, including server response time, client workload, network characteristics and protocol behavior. However, each of these factors can vary considerably between sites and their interactions vary as well. Consequently, it is challenging to know a priori which of many potential optimizations will have an appreciable impact on a given site. It is rarely cost effective to test these alternatives exhaustively. Instead, administrators must make educated guesses based on their understanding of their site's unique demands.
In response to this problem, a variety of of synthetic load testing tools have been developed [2,3,12,19]. These tools are largely based on analytic Web workload models that have been developed and validated against measurements in individual settings [4,5,9,13,14]. This synthetic approach has enormous benefits, since it is easy to set up and has the flexibility to explore a variety of workload parameters. At the same time, the underlying models require continual re-validation with up-to-date empirical data and, by their very nature, synthetic models are unlikely to match any particular site's workload with high accuracy. Moreover, few of these tools attempt to model the network conditions of the client population and therefore are poor predictors for changes in a site's implementation that are sensitive to network characteristics.
Another potential alternative is to implement protocol or network changes on a test server and then redirect a subset of real users to that server to evaluate the changes impact. This approach has the benefit of being highly realistic, but also suffers from the risk that some users will be negatively impacted. Ideally, this risk should only be taken when there is a strong reason to believe the change will offer a significant benefit.
Our work represents a middle road - offering a high degree of realism while not exposing real users to risks during testing. The tool we have developed, called Monkey, uses captured traces to accurately replay an emulated workload that is effectively identical to the site's normal operating conditions. To do this, Monkey infers delays caused by the client, the protocol, the server, and the network in each captured flow and then faithfully replays each flow according to these parameters to recreate the original workload. This approach allows a site administrator to recreate a real workload in a modified test environment - and thereby evaluate the impact of individual protocol, server or network optimizations. For example, a site with typically short data flows might wish to explore the effect of modifying TCP's initial congestion window setting, or investigate the benefits of using the TCP SACK or DSACK options to reduce spurious packet retransmissions.
To our knowledge, Monkey is the first tool of its kind and our initial experiences have been extremely positive. Using traces gathered from the popular Google search site, we have been able to replay Google client workloads with high accuracy. Moreover, we have been able to successfully predict the impact of changes made to the Google TCP implementation on overall client response time.
In the remainder of this paper we discuss related work and then describe the design challenges and trade-offs in the Monkey system. We then describe the details of Monkey's trace collection and trace replay components and finally discuss our experiences using Monkey at Google to predict the impact of protocol changes.
In his 1999 HotOS paper, Mogul offers a general indictment on the statement of systems benchmarking in use today. He argues strongly that relevant benchmarks must predict absolute performance in a production environment, rather than simply focusing on quantified, repeatable results in a carefully constructed laboratory setting [11]. Unfortunately, this goal has proved elusive in practice and few tools available today can offer strong predictions about future performance.
Most existing HTTP load testing tools, such as SPECweb99 [2], WebStone [19], Web Polygraph [3], httperf [12] are based on synthetic models of Web traffic [4,5,9,13,14]. These models are developed analytically and then validated experimentally with measurement studies. In particular, such tools are focused on creating realistic traffic mixes as a function of overall load - a role for which they have been very successful. However, these tools typically are run on local area networks and ignore the impact of variable wide-area network characteristics or protocol interactions with different client operating systems.
An exception is the Nahum et al. study [14], which investigated the impact of WAN conditions on WWW server performance by combining synthetic experiments with an emulated wide-area network [14]. While their experiments only included static HTTP transactions, they still found that variations in round-trip time (RTT), packet loss rate, as well as different TCP versions (Reno, NewReno, SACK) had significant impact on end-to-end response time. However, Nahum's study did not attempt to replicate the workload or network conditions of a particular Web site and reflected the impact of a particular synthetic parameterization.
The open-source tcpreplay tool represents a very different approach to this problem [20]. Tcpreplay takes a packet dump and replays each recorded packet without transport or upper protocol knowledge - typically to exercise firewall and security systems. Although it can also be used to replay traces against a server, tcpreplay does not separate out network, client and server conditions and therefore it will not reflect the impact of any changes to the test environment.
A slightly more advanced approach is found in the tcplib[7] tool, which simulates TCP applications (TELNET and FTP in particular) through a combination of deterministic application characteristics combined with statistical modeling of user behavior. The authors observed that wide-area TCP/IP traffic cannot be accurately modeled with simple analytical expressions, but instead requires a combination of detailed knowledge of the end-user applications and measured probability distributions of user workloads. Unlike Monkey, tcplib does not reproduce particular traces, but generates traffic according to the general characteristics revealed in a set of measurement experiments.
Zhang et al. [21] studied flow rates with traces captured from a large backbone ISP and discovered that short flow rates are over 90% application-limited or limited by slow-start behavior. Most Google flows fall into this category, where HTTP response time is highly correlated to server application delay and client slow-start behavior. Barford et al. [6] studied the cause of delays in general HTTP flows using a similar analysis, and under synthetic loads found that long response times are mainly contributed by server and client delays. These results are generally consistent with our traces of Google. 2While we were not able to directly reuse the analyses from these studies, their approach informed our inference techniques.
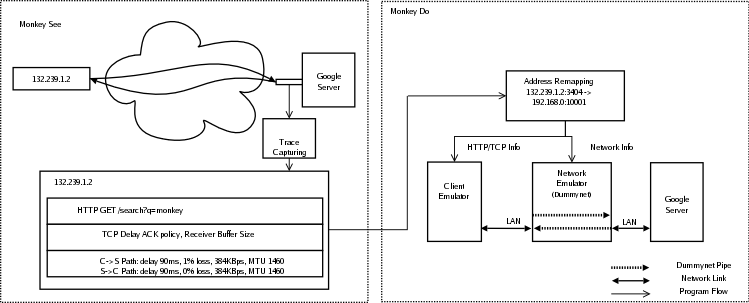
Monkey is designed to emulate a real workload by emulating client behavior (e.g., request timing, client delays, and protocol implementation), server behavior (e.g., service delay and protocol implementation), as well as network conditions (e.g., RTT, bandwidth and loss rate). Our current prototype is particularly focused on evaluating how changes in server implementation - particularly the TCP stack - affect HTTP response time.
Monkey consists of two distinct components: Monkey See and Monkey Do. Monkey See captures TCP packet traces at a standalone packet sniffer adjacent to the Web server being traced (in our case on a network tap in front of a Google search server). It then performs offline trace analysis to extract observable link delays, packet losses, bottleneck bandwidth, packet MTUs, and HTTP event timings. This connection information is stored in a database to be used in the subsequent replay step.
Monkey Do consists of a network, client, and server emulator residing on the same LAN. The network emulator is responsible for emulating the characteristics of client upstream and downstream links. The client emulator models client request timings and protocol behavior and directs its packets through the emulated virtual links. The server emulator models server delays and protocol behavior. Finally, a packet sniffer at the test server captures traffic during a replay experiment so that it can be analyzed and compared to the original trace.
 |
In the remainder of this section, we describe the Google service environment examined in our study and the design challenges and implementation details.
In its current form, Monkey is not a completely general tool. We have built Monkey in the context of the Google service environment and consequently we have been able to make simplifying assumptions based on our knowledge of this context. While most of these assumptions are common to any popular Web site, it is prudent to understand them before exploring the details of Monkey's design and implementation.
Monkey See captured packet traces using libpcap [1] on a PC host equipped with two Gigabit Ethernet cards (one each for inbound and outbound traffic). Because we use the standard interrupt-driven Linux kernel to acquire packets, high data rates can overwhelm the host (in fact, during our trace collections at Google our network cards dropped an average of 90,000 packets per second). To manage the packet drop rate, we reduce the amount of data captured by sampling flows with randomly selected values for the last octet. In our experiments we sub-sampled the traffic by a factor of 90 using this technique. Further, Monkey prunes connections that have incomplete connection handshakes, incomplete terminations (no FIN or RST) and incomplete data sequences. We also prune connections for which it is impossible to infer bandwidth estimates - typically extremely short flows that have no ACK pairs.
Once a trace is captured, Monkey See uses several analyses to extract key network and client characteristics and record these parameters into a replay database for each flow captured.
Path MTU, Delay and Loss. Client downstream and upstream path MTUs are extracted from the MSS TCP options contained in the client and server SYN packets respectively.
Monkey estimates the path propagation delays by halving the minimum RTT estimate. Since we are primarily concerned with overall response time potential propagation asymmetries are irrelevant. We use the minimum RTT because low bandwidth links, such as dial-up modems, can have very large variability in queuing delay. The minimum RTT is typically estimated between the server SYN-ACK and the first client ACK since packet queuing delays are usually small at this point.
As mentioned earlier, we assume the upstream path (ACK channel) has no loss. The downstream path (data channel) loss rate is estimated by counting the percentage of server data retransmissions. However, retransmissions may be spurious and cause Monkey to overestimate the loss rate. To address this problem, we employ the following heuristic. Assuming that packet reordering is rare, any duplicate acknowledgment sent in response to a retransmission indicates that the retransmission was spurious. Therefore, we can compute the packet loss rate as the number of retransmissions minus the number of duplicate acknowledgments, divided by the number of total server packets sent. In an environment using the TCP DSACK option [8], we could disambiguate spurious retransmissions even in the presence of packet reordering, but it is not in use on Google servers.
Link Bottleneck Bandwidth. Monkey uses the packet pair technique to measure bottleneck bandwidth. As mentioned in Section 3, Monkey assumes that packet queuing and congestion only happen at the end of the server to client path - the path from client to server is never congested. Hence, packets sent in a burst remain back-to-back when they arrive at the bottleneck link, e.g., modem, DSL lines, etc. If the client acknowledges packets immediately, Monkey obtains the bottleneck queue bandwidth by measuring the ACK time spacing. Sariou's sprobe tool [16] uses a similar technique, but Monkey measures all possible ACK pairs while sprobe only uses one.
A challenge in using this technique is that TCP can delay an ACK for up to several hundred milliseconds [18] while waiting to receive another packet. This delay can lead to either under-estimates or over-estimates depending on the timing. Therefore Monkey discounts bandwidth estimates taken on ACK pairs that cover sequence numbers corresponding to data packets sent in separate bursts. On average, we are able to extract approximately three or four bandwidth estimates for each connection.
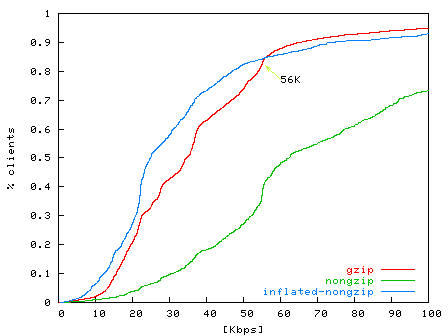 Figure 2: CDF of estimated bandwidth of dialup clients from level3.net . Over 80% are below 56 Kbps. The non-gzipped connections over-estimate application-level bandwidth, while the inflated-nongzip line reflects the adjustment of a compression factor of 2.5. The gzipped connections are not affected by modem compressions. |
 Figure 3: CDF of estimated bandwidth of DSL users from pacbell.net. 9% have less than 56 Kbps and 90% connections have bandwidth beyond the maximum rate 6 Mbps. Note that time is measured with millisecond granularity, therefore bandwidth estimates over 1.5 Mbps (1460 bytes/1ms) can have large errors. |
We have run two unit-tests to verify Monkey's bandwidth estimation. The first test measures the dial-up bandwidth for clients from level3.net with DNS hostnames containing the keyword dialup. We noticed that many of these connections present higher effective bandwidth than the maximum downstream modem speed of 56 Kbps. The cause for this discrepancy is that modern modems employ on-line compression. Since we cannot infer the actual compression ratio, we adjust the over-estimated bandwidth with a conservative compression factor of 2.5 for transactions containing non-gzipped HTML text [10]. As shown in Figure 2, after this adjustment, Monkey estimates that 80% of connections have bandwidths less than 56 Kbps. The second test measures the ADSL bandwidth for hostnames containing the keyword dsl from pacbell.net. As shown in Figure 3, 88% of connections have bandwidths between 56 Kbps and the highest subscriber speed of 6 Mbps. Higher rates in the graph represent over estimates.
TCP Delayed ACK Policies. When replaying a connection, it is critical to understand the behavior of the client-side TCP implementation. In particular, for short flows one of the most critical parameters is the delayed ACK policy. Since most Google flows (indeed, most Web flows in general) are short and never exit TCP's slow start phase, the rate of client ACKs may dominate the overall HTTP response time equation. In particular, while the Linux TCP stack does not delay acknowledgments when it believes the sender is in slow start, Windows clients delay ACKs uniformly. Monkey infers the delayed ACK policy in slow start by comparing the number of ACKs and data packets observed before the first loss occurs or the connection ends.
TCP Receiver Buffer Size. In addition to delayed acknowledgments, small TCP receiver buffers at the client can significantly limit server response time due to blocking on TCP flow control. Monkey records the advertised receiver window (RWIN) in the first HTTP request packet as the client buffer (we do not record the RWIN value contained in the initial SYN packet because Windows clients frequently use a small RWIN value in the SYN and then increase RWIN upon sending the HTTP request). Note, due to time constraints, the current implementation of Monkey Do does not emulate client TCP receiver window size. However, in an offline analysis we have determined that fewer than 0.4% of connections are limited by TCP flow control in our traces. For server applications with larger flows we expect that a better emulation of client buffering would be necessary.
TCP Connection Termination. Some client TCP implementations, notably Windows, send TCP RST to close connections rather than using an explicit FIN handshake. Consequently, it is ambiguous if a RST is due to an abort or a normal TCP close. Monkey assumes that if a RST is delivered after the end of an HTTP response, the client has received the data and intends to close the connection. Note that, since the choice of RST or FIN does not affect the HTTP response time, we have not emulated the RST termination behavior in Monkey Do.
HTTP messages. Monkey records the content and the timings of each HTTP message from the original trace. Notice that we do not need to decompress or parse the contents of the messages since Monkey only replays up to the HTTP level.
Monkey Do uses a client emulator, a network emulator, and a server emulator to replay traced connections, as shown at the bottom of Figure 1. All emulators run on separate machines on a well-provisioned LAN.
The network emulator uses Dummynet [15] to recreate the network conditions that were inferred from the trace during replay. For each HTTP connection, Monkey creates two Dummynet ``pipes'' as the forward and backward path with the corresponding delay, loss, and bandwidth inferred from the original trace. Currently Dummynet can support approximately 4000 simultaneous pipes (unique and independent network paths) while still forwarding packets between the client and server emulator with less than a millisecond of delay added.
Monkey configures the Dummynet pipe queue lengths based on the suggested value in [15]. For modem connections with bandwidths less than 56 Kbps, both the uplink and downlink pipe queue lengths are 5 packets. For DSL and cable modem connections have bandwidths ranging from 56 Kbps to 6 Mbps, Monkey sets the uplink queue to 10 packets and the downlink queue to 30 packets [15]. For the remaining high-speed connections, Monkey uses the default queue length of 40 packets.
At the start of replay, Monkey reads connection information from the replay database. For each connection, Monkey creates a new replay TCP connection identifier (source IP, source port, destination IP, and destination port) and maps it to the original TCP connection identifier. This mapping enables the client and network emulators to associate replayed connections initiated at the client emulator with the appropriate emulated network conditions at the network emulator. Figure 1 shows an example mapping for single connection.
Since Dummynet cannot do MTU emulation, Monkey uses the TCP_MAXSEG socket option in our replayed client and server sockets to model MTU in our replay network. 3
The client emulator replays client HTTP requests in-sequence by establishing connections to the server emulator through the network emulator. For each connection, Monkey creates user-level sockets using the same TCP addresses as the replayed TCP connections. It then configures the TCP receiver buffer size and delayed ACK policies as recorded in Monkey Do (Section 3.2) using the TCP_RCVBUF and Linux-specific TCP_QUICKACK socket options, respectively.
To accurately emulate client behavior, Monkey needs to determine client event timings such as the connection start and termination times, and the HTTP request time. Since Monkey only uses server-side traces, it infers the timing of events at the client based upon an estimate of the one-way network delay (half the measured RTT). It models the client connection time as the SYN packet time in the trace minus this network delay, the HTTP request time as the first client packet minus network delay, etc.
Finally, we describe our server emulator, how it emulates the HTTP behavior of a Google server interacting with a client, and how we parameterize it to model HTTP performance during replay. This is necessary because we cannot rely on a production server to accurately replicate the trace's application-level delays due to changes in the contents of Google's search result cache at different points in time.
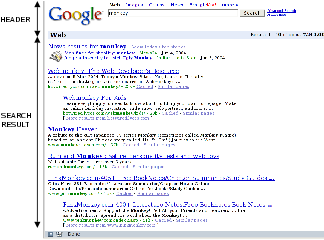
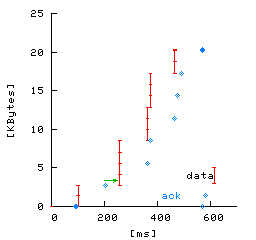
The behavior and performance of a Google server fundamentally depends upon the nature of a Google search request and response. A Google search request is usually short (1-3 packets). A Google search response is usually longer (3-15 packets) and consists of two parts: a short, 3 KB search-independent Google header (the Google search form), and then the search results (see Figure 5a). Figures 5b and 5c illustrate packet timings of two typical Google search flows. In these figures, the x-axis shows the time at which packets are sent and received by the Google server and the y-axis shows the relative packets sequence number from the start of the connection. The small hash marks connected by lines show data packets for the HTTP response sent by the server, and the large crosses show the time and ACK sequence number of client ACKs received at the server. Figure 5b shows a typical uncompressed HTTP response consisting of 15 response packets and 8 client ACKs. Figure 5c shows a typical gzipped HTTP response consisting of only 4 response packets and 4 client ACKs; note that the use of compression significantly reduces the number of packets exchanged between the server and client.
 |
 (a)
|
 (b)
|
 (c)
|
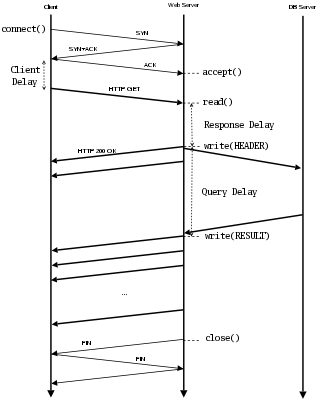
Figure 4 shows the interaction of a Google client and server as a time line of packet exchanges. To reproduce the server behavior in the replay, we measure the server delays in the original trace and emulate them in the replay. First the client establishes the connection and sends the HTTP request. The server typically spends several milliseconds processing this request, a period of time we call the response delay. Next, the server simultaneously queries the appropriate database and sends out the Google header to the client. Therefore, we can measure the response delay as the difference between the timestamps of the last request packet and the first response packet (which consists of the Google header).
Finally, the server waits until the result database returns the
result - the query delay. Measuring the query delay
can be challenging since the time at which the server starts to send
search result data is not explicitly apparent from Monkey's vantage
point. This information is not directly available from the packet
payload, due to HTTP compression, nor can it be inferred purely from
inter-packet delays since similar pauses can be caused by congestion
or flow control. Instead, we analyze two aspects of TCP's behavior to
differentiate application-level delays (attributed to query overhead)
from network-level delays. First, since TCP packet delivery is ACK
triggered4, if the
client has acknowledged all
outstanding server data packets, but the server has not sent more data,
we can infer that the server has blocked waiting for application
data. Second, since Linux's TCP implementation always packs data
into packets of the Maximum Segment Size (MSS), we can tell that
the server's sending buffer is empty after it sends a sub-MSS-sized
packet. Based on these two observations, we develop an algorithm to
estimate the query delay as follows:

In
the above algorithm, tcp_segments[i]
refers to the ith TCP segment
sent by the server (i.e., tcp_segments[0]
refers to the SYN/ACK packet).
The key goal of the algorithm is to detect which is the last packet of
the Google header and which is the first query result packet and return
the difference in their timestamps. For each pair of sequential
packets,
starting with the first data packet, we check if there is significant
delay between the packets - that they are not sent in the same burst -
and that the previous packet was acknowledged before the current packet
was sent. If so, we estimate query delay as the interval between the
first
and current data packets. For example, in Figure 5a,
Monkey correctly estimates the query delay as the interval
between the 1st packet and 3rd packet. However, if the query delay is
dominated by the
round-trip time or if the client delays the ACK of the previous packet,
then
this test will fail. Instead we check if the current packet is less
than
full-sized as an indicator that this is the end of a header sequence
(this
heuristic will fail only if the size of last packet that contains the
header
is exactly MSS bytes). For example, in Figure 5b,
the 1st packet is acked after the 2nd packet is sent, but 1st packet
size is 1287 < 1460 = MSS, hence the query
delay is the interval between the 1st and 2nd packet. If neither
test is satisfied
then we consider the next pair of packets until completion.
After Monkey infers the server delay information from the trace, the server emulator uses it to mimic a Google server. It accepts requests from clients, emulates the server delays by idling, then writes HTTP responses. The server emulator runs on the same kernel as the Google servers so that kernel and protocol implementations are unchanged.
In this section, we describe the types of connections in the Google search traces we use to evaluate Monkey, and the hardware platform we use for performing our experiments in Section 5.
For the experiments in Section 5, we use Monkey See to capture traces of TCP connections to the Google servers for replay with Monkey Do. Section 3.2 describes how Monkey See selects TCP connections to capture in a trace. Because these traces contain more than just Google search traffic, though, we also filter the connections based upon application criteria as well. Since we are focused on Google search performance, we exclude all connections to all other Google services such as page ranks, images, news, or group search.
We also exclude search connections from ISPs that provide search services from Google through dedicated proxies. These ISPs have high network bandwidth and low network latencies. As a result, their connections are usually very short and the HTTP response time is dominated by the RTT.
Finally, of the remaining Google search connections, we exclude searches that use persistent connections (25% of search connections). Modeling persistent connections is a challenging problem since the HTTP response times are highly dependent on the TCP effective window size at the server at the end of the previous transaction, and remains future work.
For the experiments in Section 5, the client emulator is one machine running Linux 2.4.20, the network emulator is another machine running FreeBSD 5.1, and the server emulator is a third machine running a Google Linux kernel. All machines have Pentium 4 2.66 GHz CPUs and 1 GB of main memory, and are connected by a dedicated 100Mbit Ethernet switch.
In this section, we perform two experiments to evaluate the effectiveness of Monkey's replay features. First we evaluate the ability of Monkey to accurately replay traces from a Google server on the Monkey client, network, and server emulators, demonstrating that Monkey can accurately reproduce HTTP connection response times for a large fraction of traced connections. Then we demonstrate Monkey's ability to predict the performance of a server optimization.
 |
 |
 |
We start by evaluating how well Monkey can reproduce the behavior and performance of Google search transactions. To do this, we compare the performance of search transactions to a Google server with the same search transactions modeled by Monkey. In this experiment, the Monkey server emulator uses the same kernel settings as the Google servers that originally performed the search requests. Assuming that Monkey models the client, network, and server behavior and performance accurately, then the HTTP response times of the replayed search transactions should match the response times observed in the trace. We define the HTTP response time as the interval from the time of the first byte of the request received to the time of the last byte of the response sent from the server.
For this experiment we use a trace of 6990 connections from 2:15-3:06pm on a weekday in November, 2003. To compare search transaction performance from the trace with search performance of the replay, we use a metric of relative error in HTTP response time. We compute relative error as the replay response time minus the trace response time, divided by the original response time. A relative error of 0.0 indicates the replay response time matched the trace response time exactly, a negative error indicates that the replay underestimated response time, and a positive error indicates that the replay overestimated response time.
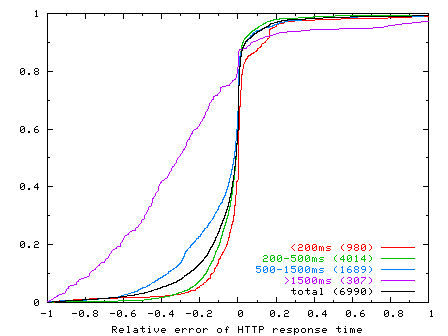
Figure 6 shows the CDF of the relative error in HTTP response time across all replayed connections. The figure shows CDFs for all connections (``total''), as well as subsets of connections categorized by their HTTP response time; the number in parentheses in the legend label of these CDFs shows the number of connections in the category. For example, the dark solid CDF curve shows the relative error of the HTTP response time for all connections whose response times were less than 200 ms (``< 200ms''), and that there were 980 out of 6990 (14%) such connections.
From this graph we make a number of observations. First, Monkey performs reasonably well in reproducing HTTP response times when replaying the traces. Over 86% of the connections replayed within +/-20 relative error. Second, when Monkey replay performance differs from the original trace, it tends to underestimate response times. Over 60% of replayed connections had a negative relative error. Third, Monkey's ability to accurately replay connections correlates with the HTTP response time of the original connection. Monkey replays connections with fast response times more accurately than those with slow response times. For example, over 94% of connections with response times less than 200 ms had a relative error of +/-20. And Monkey's accuracy progressively degrades for slower connections. At the other extreme, only 29% of connections with response times greater than 1500 ms had the same relative error. We discuss this issue further below.
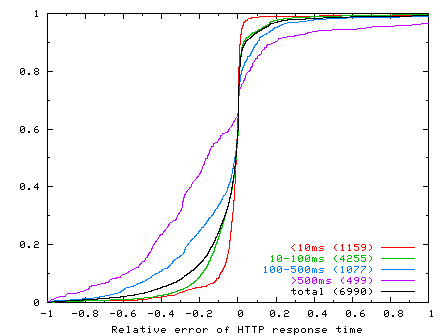
To study Monkey's replay ability from different perspectives, we also correlate Monkey's relative error to estimated bottleneck bandwidth and minimum RTT. Figures 7 and 8 show the CDFs of relative error in HTTP response time according to connections categorized by their estimated bottleneck bandwidths and minimum RTTs, respectively, of the original connections in the trace. From Figure 7, we see that Monkey's replay accuracy also correlates with bottleneck bandwidth. Monkey does well for high-bandwidth connections, but progressively worse for low-bandwidth connections. Similarly, Figure 8 shows that Monkey does well with connections with low RTT and progressively worse for connections with higher RTT. Given the results shown in Figure 6, the results in these graphs are not too surprising since bottleneck bandwidth and minimum RTT also correlate strongly with HTTP response time: higher bandwidths and smaller RTTs result in smaller HTTP response times.
In Figure 6 we saw that, when Monkey does not replay a connection accurately, it tends to underestimate connection response time. By manually inspecting various original and replayed TCP flows, we found that Monkey's replay tends to have a more aggressive delayed ACK policy than the connections from the Windows clients in the trace, which together totaled over 90% of all connections. As a result, Monkey's replayed connections will tend to perform faster than the original connections. Recall from Section 3.3.2 that Monkey uses Linux to emulate the clients in a trace. The Linux delayed ACK timeout on average is less than the Windows delayed ACK timeout. Linux provides a special TCP_QUICKACK setsockopt option to control ACK timeouts, but the kernel does not always obey the option setting and may still send an immediate ACK even when Monkey disables it. Further, Linux always sends out an ACK after it receives two consecutive in-sequence packets, but Windows may send out only one ACK for data bursts of four packets. As a result, the mean RTT in the replay is likely to be smaller than the mean RTT in the original for these connections.
Next we evaluate Monkey's ability to predict the performance of optimizations made to a Google server on a given client workload. In this experiment, we (1) trace the performance of a client workload on an original Google server, (2) trace the performance of an equivalent client workload on an optimized Google server, and then (3) use Monkey to replay the workload from the original Google server on our server emulator modified with the same optimization. By comparing the performance of the optimized Google server trace with the performance of the replayed unoptimized trace on the optimized server emulator, we can evaluate Monkey's ability to predict performance of server modifications using trace replay.
For this experiment, the optimization that we make to the Google server and server emulator is to increase the TCP initial congestion window from 1 to 3. This optimization makes TCP more aggressive in sending data, thereby decreasing overall HTTP response time.
Ideally, we would like to use the same client workload on both the unoptimized and optimized Google servers in steps (1) and (2). However, it is impractical to do so. For example, we could not shadow the same workload simultaneously on two Google servers that differed in their initial congestion window but were otherwise exactly the same in terms in state and load. Instead, we use two equivalent workloads to the unoptimized and optimized Google servers. These workloads do not have the same TCP connections, but their overall distributions of connection performance (HTTP response time) are effectively identical. As a result, although we cannot compare workloads on a connection-by-connection basis, we can compare their overall distributions.
 |
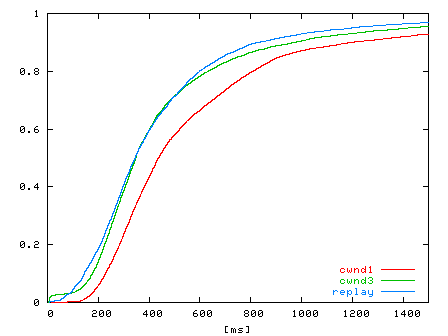 |
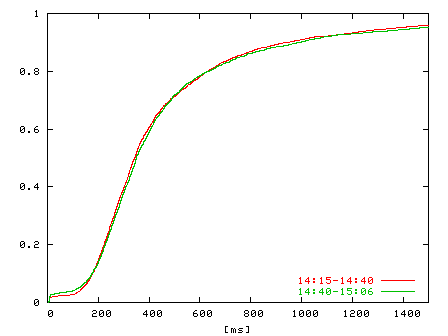
| Figure 9: CDF of HTTP response times for two halves of a trace collected from 2:15-2:40pm and 2:40-3:06pm on a weekday in November, 2003. | Figure 10: CDF of HTTP response times for traces Tcwnd1, Tcwnd3, and Treplay. Traces Tcwnd3, Tcwnd1, and Treplay have 7109, 6923, and 6841 connections, respectively. |
To validate this approach, we use a trace to a Google server from 2:15-3:06pm on a weekday in November, 2003. We divide the trace in half in time, from 2:15-2:40pm and 2:40-3:06pm, and compare the distributions of HTTP response time for both halves of the trace. Figure 9 shows the CDFs of the HTTP response time distributions of the trace halves. From the figure, we see that the distributions are nearly identical. For the purposes of this experiment, we therefore consider two relatively short workload traces taken immediately after each other in time to be equivalent workloads in terms of their HTTP response time distributions.
To evaluate Monkey's ability to predict performance, we began with a trace Tcwnd1 of a client workload to a Google server with its TCP initial congestion window set to 1. We recorded trace Tcwnd1 from 1:30-2:15pm on a weekday in November, 2003. We then changed the TCP initial congestion window of the Google server from 1 to 3, and immediately recorded a trace Tcwnd3 of the client workload from 2:15-3:06pm (the trace used in Figure 9 above). We then used Monkey to replay the Tcwnd1 trace on the server emulator running a Google kernel with a TCP initial window of 3, resulting in a trace Treplay of replayed connections.
We evaluate the ability of Monkey to predict the performance of an optimized server using a trace from an unoptimized server by comparing the distributions of HTTP response times in traces Treplay and Tcwnd3. The closer these distributions are, the better Monkey is at predicting the performance of this server optimization on an unoptimized client workload.
Figure 10 shows the CDFs of the HTTP response time distributions for traces Tcwnd1, Tcwnd3, and Treplay. Comparing the distributions of traces Tcwnd1 and Tcwnd3, we see that increasing the TCP initial congestion window decreases HTTP response time, effectively shifting the distribution left over 100 ms. Recall that Treplay is a replay of Tcwnd1 on a Google server emulator with TCP initial congestion window set to 3, the congestion window value of trace Tcwnd3. Comparing the distributions of Treplay and Tcwnd3, we see that the distributions match well within the 200-550 ms response time range, demonstrating that Monkey can predict performance well for this optimization in this range of client connections.
Recall from Section 5.1 that Monkey underestimates HTTP response time for connections that originally experienced relatively large response times in the trace. As a result, we expect the Treplay distribution to also slightly underestimate the Tcwnd3 distribution at large response times. Furthermore, in this experiment, Monkey overestimates response times for connections with response times under 100 ms. This is because with an initial congestion window of 1, the connection is stalled waiting for a delayed ACK from the client. This delay overlaps, and hides, the actual search delay - leading to an overestimate.
While Monkey is able to offer strong predictive power in the Google environment, an obvious question is how well this approach might generalize to other Web environments, or even further to other TCP applications. In general, there are several classes of problems presented by different environments: network dynamics, server emulation, and client analysis.
In its current form, Monkey makes several simplifications in its network model which, while appropriate for Google, may require significant extensions for other settings. For example, Monkey currently models packet losses as independent and identically distributed. In environments with single flows long enough to stress intermediate queues, the pattern of losses may be neither. Similarly, several of the algorithms depend on regular acknowledgments returning from the client - assuming the reverse path congestion is rare. While many of these complexities can be addressed with better analysis algorithms, others represent inherent ambiguities. For example, the free-running nature of client-based delayed ACK timers makes the source of acknowledgment delay inherently ambiguous.
Another concern is the potential need for specific server emulators for each new application. However, this requirement is limited to those applications that have strong performance dependencies between sets of operations - such as the result caching employed in the Google system. In this setting the server emulator prevents these dependencies (e.g., all results from the trace being already present in the result cache) from skewing the results. However, for systems in which the performance distribution is ``memoryless'' and independent of the particular order and time of requests there is no need for a server emulation. Consequently, in most Web or content distribution environments, the trace can be directly replayed against the original server.
Finally, the current version of Monkey does not model client interactions. We cannot predict the impact of faster response times on future request arrivals. In general, it is unlikely that a complete end-to-end ``closed-loop'' analysis can be extracted purely from a TCP stream.
Using realistic, large network traces from the popular Google search site we show that Monkey replays traces with a high degree of accuracy. We also demonstrate that Monkey can be used to predict the effect of changes to the TCP stack by showing that the measured impact of changes in the simulated environment closely corresponds to the impact of measurements taken on the actual system. In the end, we believe it is unrealistic to build a generic one-for-all TCP replay tool. But it is possible to build replay tool for specific applications as Monkey.
Monkey source is publicly available at: https://ramp.ucsd.edu/monkey/
|
This paper was originally published in the
Proceedings of the 2004 USENIX Annual Technical Conference,
June 27-July 2, 2004, Boston, MA, USA Last changed: 6 June 2004 jel |
|