Large Language Models (LLMs) have presented impressive performance across several transformative tasks, such as chatbot and code generation. However, it is non-trivial to efficiently utilize large-scale cluster resources to develop LLMs, often riddled with numerous challenges such as frequent hardware failures, intricate parallelization strategies, and imbalanced resource utilization. A thorough analysis of cluster workloads is essential for comprehending challenges and uncovering opportunities in designing systems tailored for LLMs.
To this end, we present an in-depth characterization study of a six-month LLM development workload trace collected from our GPU datacenter Acme of Shanghai AI Laboratory. Specifically, we investigate discrepancies between LLMs and prior task-specific Deep Learning (DL) workloads, explore resource utilization patterns, and identify the impact of various job failures.
Prior DL workloads generally follow a task-specific paradigm that trains the model on domain-specific data to tackle a particular task (e.g., translation). In contrast, LLMs follow an emerging paradigm that performs self-supervised training on broad data to generate a foundation model and further adapts to a wide range of downstream tasks. This shift signifies a substantial divergence in the model development pipeline and workload characteristics from prior DL workloads. Additionally, there are more unique characteristics and requirements of LLMs.
1. Unified Model Architecture. Prior DL workloads usually employ various model architectures (e.g., CNN, LSTM, GNN) to address diverse tasks. In contrast, LLMs commonly embrace the Transformer [1] architecture, like OpenAI GPT and Meta LLaMA. The architectural homogeneity suggests a high level of uniformity in the LLM development pipeline and similarity across different datacenters.
2. Requirements of Tailored Software Stack. To accommodate the enormous model size of LLMs, a series of systems implement advanced techniques to optimize the execution of LLMs. For instance, Microsoft DeepSpeed [2] and NVIDIA MegatronLM [3] accelerate the training via hybrid parallelism or state-sharding optimizer. As for model serving, vLLM [4] improves throughput via iteration scheduling and memory management.
The development of LLMs necessitates the use of extensive computational infrastructure due to their substantial model size (comprising billions of parameters) and the vast amount of training data involved. Figure 1 depicts the comprehensive LLM development pipeline, encompassing five distinct stages (blue blocks) that span from scratch to service (follow blue arrows). The grey circular arrow indicates that the pretraining stage enables periodical alignment and evaluation to assess intermediate models and adjust configuration on the fly. We explain each stage as follows:
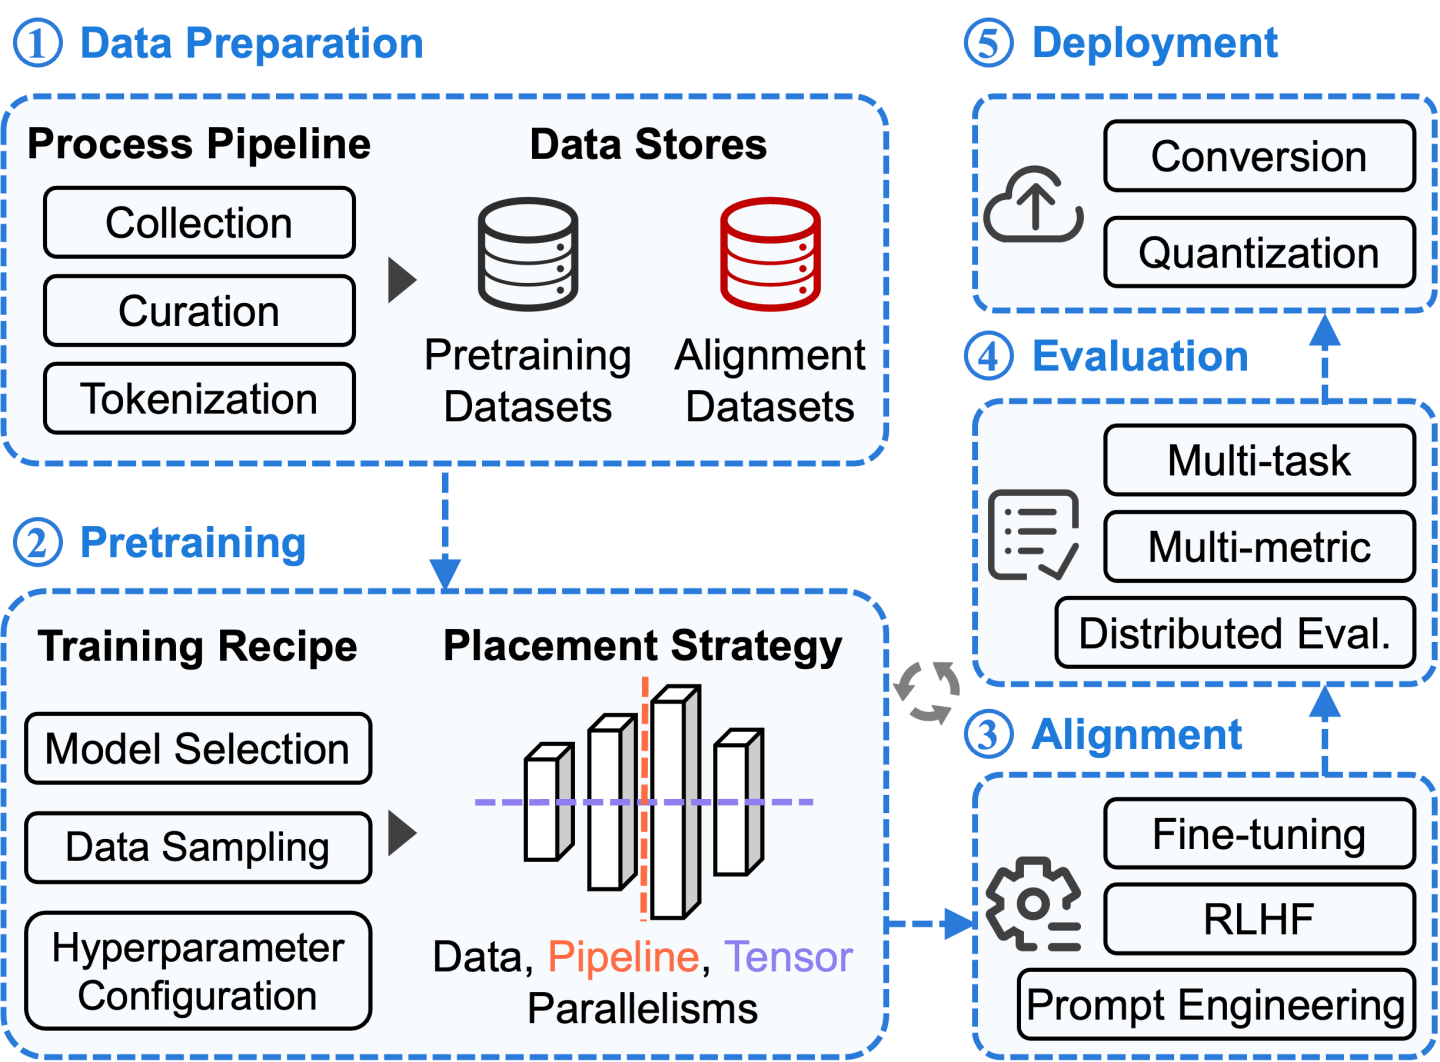
- Data Preparation. The initial stage involves gathering and preprocessing the training data, which can be categorized into two parts: (1) pretraining data, consisting of extensive unlabeled corpora obtained from public or private sources and curated through processes like detoxification and deduplication; (2) alignment data, comprising a smaller set of high-quality labeled corpora used to align the model with specific tasks. This data is typically acquired through expensive human annotation or labeling. Besides, all the data must be tokenized to ensure compatibility with the model's input.
- Pretraining. It involves self-supervised training on large-scale curated data, demanding a majority of resources within the overall development workflow. Training LLMs efficiently at scale necessitates various system innovations, such as state-sharding optimizers [2], meticulous model placement using data, pipeline, and tensor parallelisms [3].
- Alignment. This stage aims to adapt LLMs with user intent on a wide range of downstream tasks. Two primary aligning paradigms are commonly used: (1) prompt engineering, specifying prompts (i.e., inputs) without modifying model parameters. For example, in text summarization, appending a prompt “TL; DR” to the input article can improve model performance; (2) fine-tuning, updating model parameters on a task-specific dataset to improve performance in a particular domain.
- Evaluation. Given the vast application scenarios of LLM, it may be inaccurate to assess model quality solely based on a single metric like training loss. There are numerous factors to consider, such as accuracy, fairness, and toxicity. Consequently, it is crucial to account for a diverse set of criteria and measure performance across multiple tasks. Furthermore, regular evaluation is essential during the pretraining stage to provide timely feedback on model quality.
- Deployment. To meet the strict cost and latency constraints of LLM applications, several advanced techniques have been developed to achieve efficient model serving, including quantization, distillation, CUDA kernel optimization, model parallelism and memory management [4].
Developing LLMs is closely intertwined with the support of GPU clusters in various aspects. However, many conclusions and implications from existing DL workload analysis work [5], [6], [7], conducted before the rise of LLMs, are not applicable to LLM development. Consequently, conducting a comprehensive analysis of cluster workloads becomes crucial for understanding the unique challenges and identifying potential opportunities in designing systems optimized for LLMs.
In this work, we share our operational experiences in the datacenter Acme of Shanghai AI Laboratory. It houses two distinct clusters, Seren and Kalos, dedicated to LLM development and equipped with 4,704 A100 GPUs in total. Table 1 summarizes the configurations of these two homogeneous LLM clusters. Each node is equipped with 8x NVIDIA A100-SXM 80GB GPUs, which are interconnected by NVLink.
| Cluster | #CPUs | GPUs | Mem(GB) | Network | #Nodes | Total #GPUs |
|---|---|---|---|---|---|---|
| Seren | 128 Cores | 8 x A100 | 1,024 | 1 x 200Gb/s | 286 | 2,288 |
| Kalos | 2,048 | 5 x 200Gb/s | 302 | 2,416 |
Our characterization study is based on traces collected from these two LLM clusters, spanning 6 months from March to August 2023. Note that Acme does not involve any serving jobs (i.e., workloads in the deployment stage), as our LLMs are deployed on a separate cluster. We compare our trace with prior DL traces, including Microsoft Philly [5], SenseTime Helios [6], Alibaba PAI [7]. Unlike Acme, which is solely dedicated to LLM development, these datacenters encompass a mixture of general DL workloads from various domains. We highlight several key findings from our analysis.
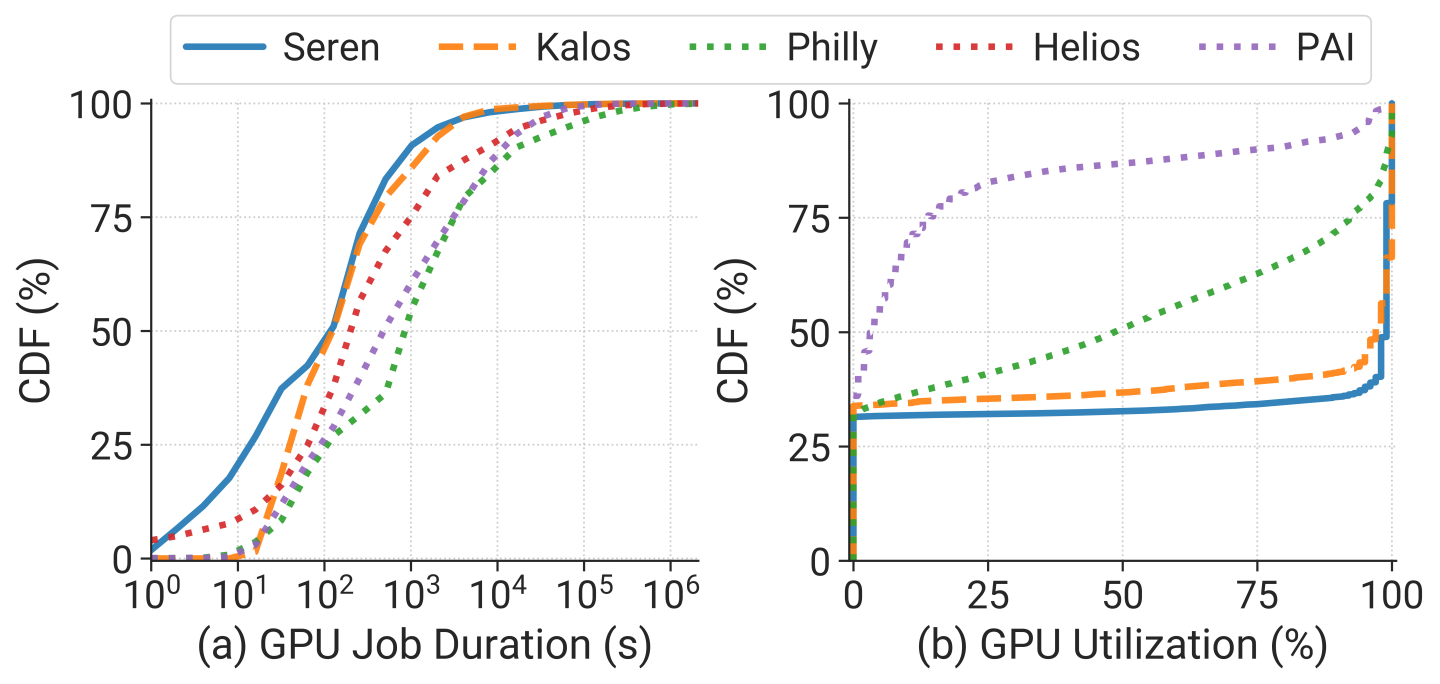
1. Shorter Job Duration. As shown in Figure 2 (a), contrary to the prevailing stereotype that LLM-related jobs are typically long-running, we find the workloads in our clusters (blue and orange lines) exhibit shorter GPU job durations (i.e., job runtime, excluding queuing delay) compared to the DL workloads observed in previous job traces (dotted lines). Specifically, both the Seren and Kalos have a median job duration of 2 minutes, which is 1.7~7.2x shorter than the median job durations of other clusters.
To provide an explanation for this observation, we outline several potential factors:
(1) Advancements in hardware. The evolution of GPU and networking delivers substantial efficiency improvement. Moreover, there is a trend of users requesting more GPU resources than what was typical in previous clusters, which can markedly speed up the training process.
(2) Extensive associated workloads. LLM development pipeline involves numerous small-scale associated jobs, such as evaluation. We will delve into this aspect later.
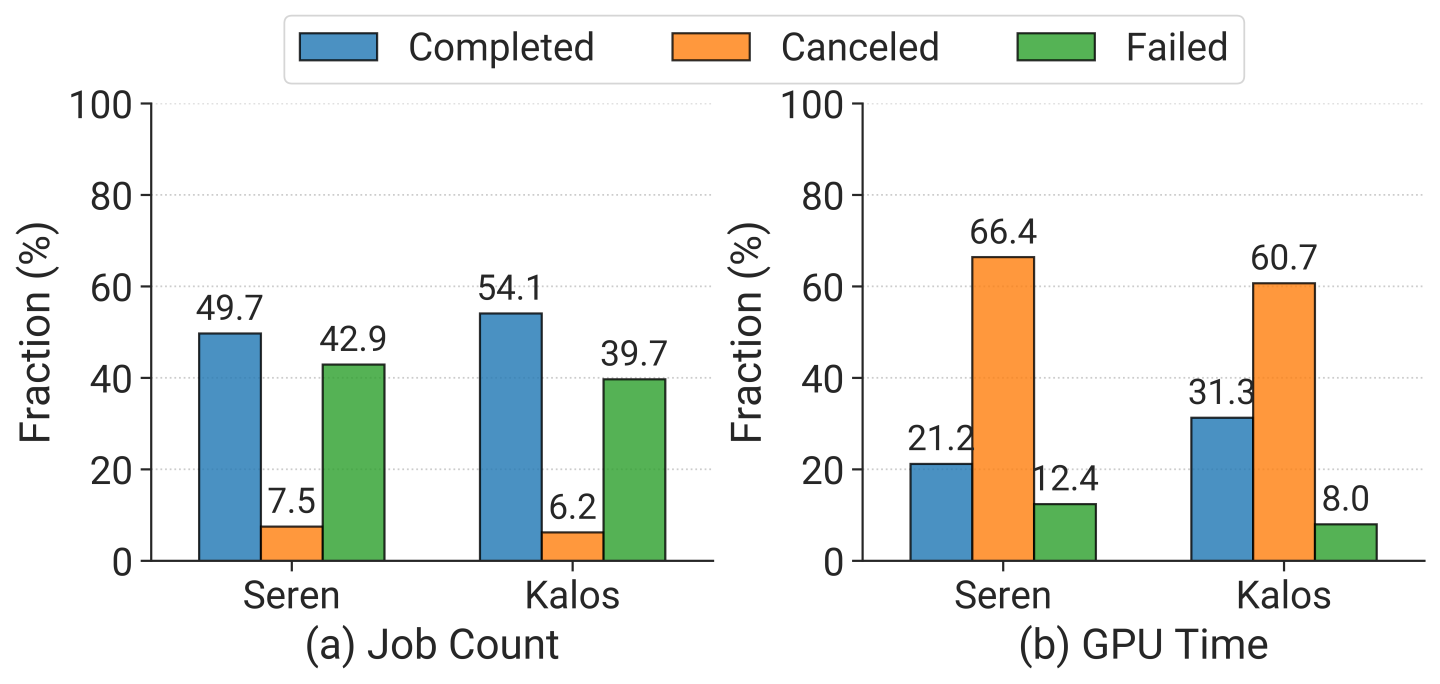
(3) High rate of incompletion. Upon examining the final statuses of jobs, as depicted in Figure 3, we find that approximately 40% of jobs fail, with completed jobs consuming only 20~30% of GPU resources. This underscores the urgent need for a fault-tolerant system.
2. Polarized GPU Utilization. Figure 2 (b) shows cluster-wide GPU utilization distributions across various clusters. It is evident that the GPU utilization in our two clusters exhibits a polarized pattern, primarily concentrated in two distinct states: 0% and 100%. This polarization mainly stems from the fact that the workloads in our clusters share similar model architectures, i.e., transformer-based LLMs. In contrast, Philly and PAI encompass a broader range of utilization. Besides, when comparing the median GPU utilization, Seren and Kalos exhibit significantly higher values at 97% and 99%, respectively, in contrast to 48% and 4% observed in Philly and PAI. This observation aligns with the common understanding that LLMs are computationally intensive. It also implies that GPU-sharing-based scheduling techniques may not be suitable for LLM development.
To strive for a deeper understanding of the characteristics of different workloads in the LLM development pipeline, we further categorize jobs into specific types according to their production division and metadata.
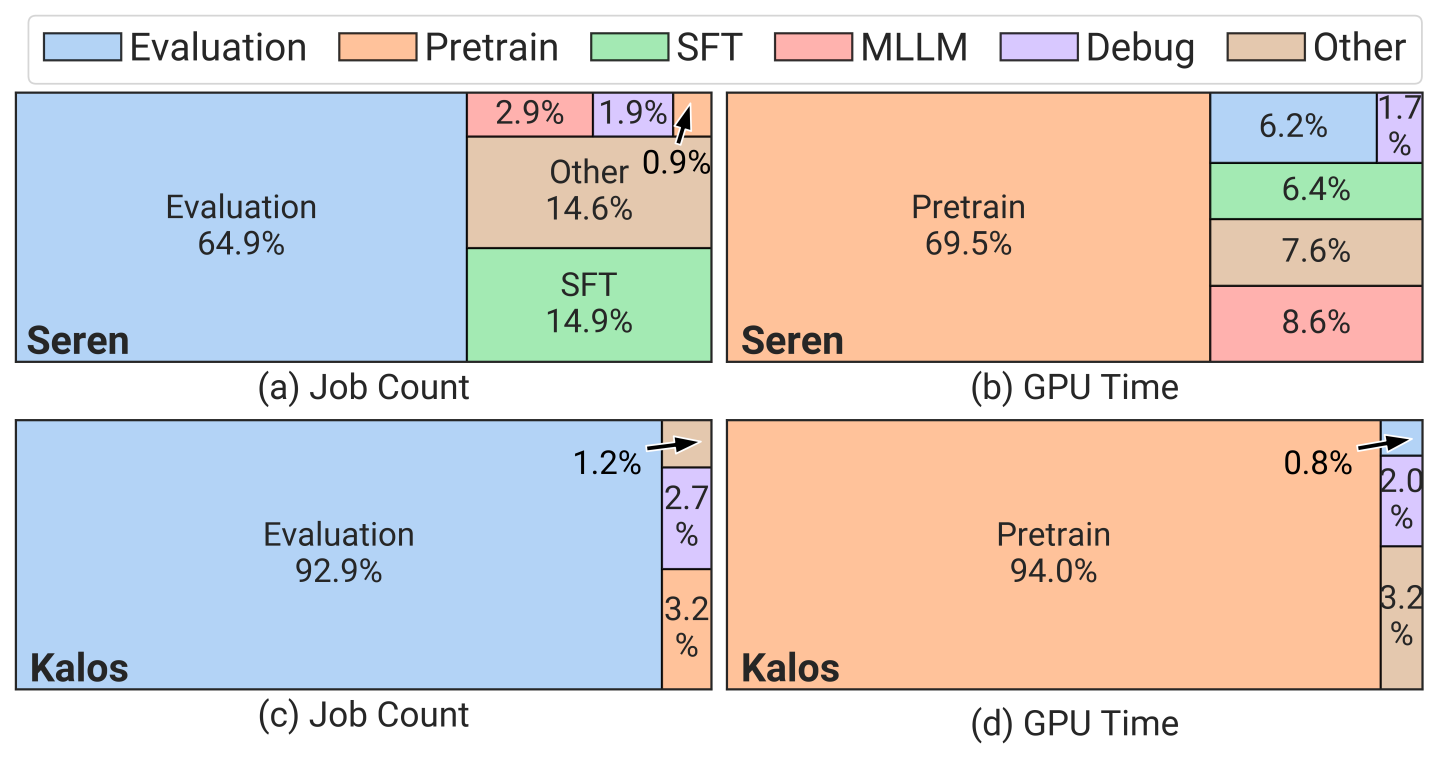
1. Highly-skewed Workload Distribution. Figure 4 presents the distribution of job counts and GPU time across various workload types, where only Seren contains SFT and MLLM workloads (SFT: Supervised Fine-Tuning for model alignment. MLLM: Multimodal Large Language Model. Other: Unclassified jobs). Note that CPU jobs are excluded. Besides, MLLM jobs incorporate their own development pipeline (e.g., pretraining) and adopt smaller model scales for exploration purposes. Our analysis primarily focuses on LLM jobs. It is obvious that evaluation jobs constitute the majority of the total job count in both clusters, yet they consume a relatively small portion of resources (0.8% in Kalos). In contrast, pretraining jobs only account for 0.9% and 3.2% of the total job count but consume 69.5% and 94.0% of the total GPU time in Seren and Kalos respectively.
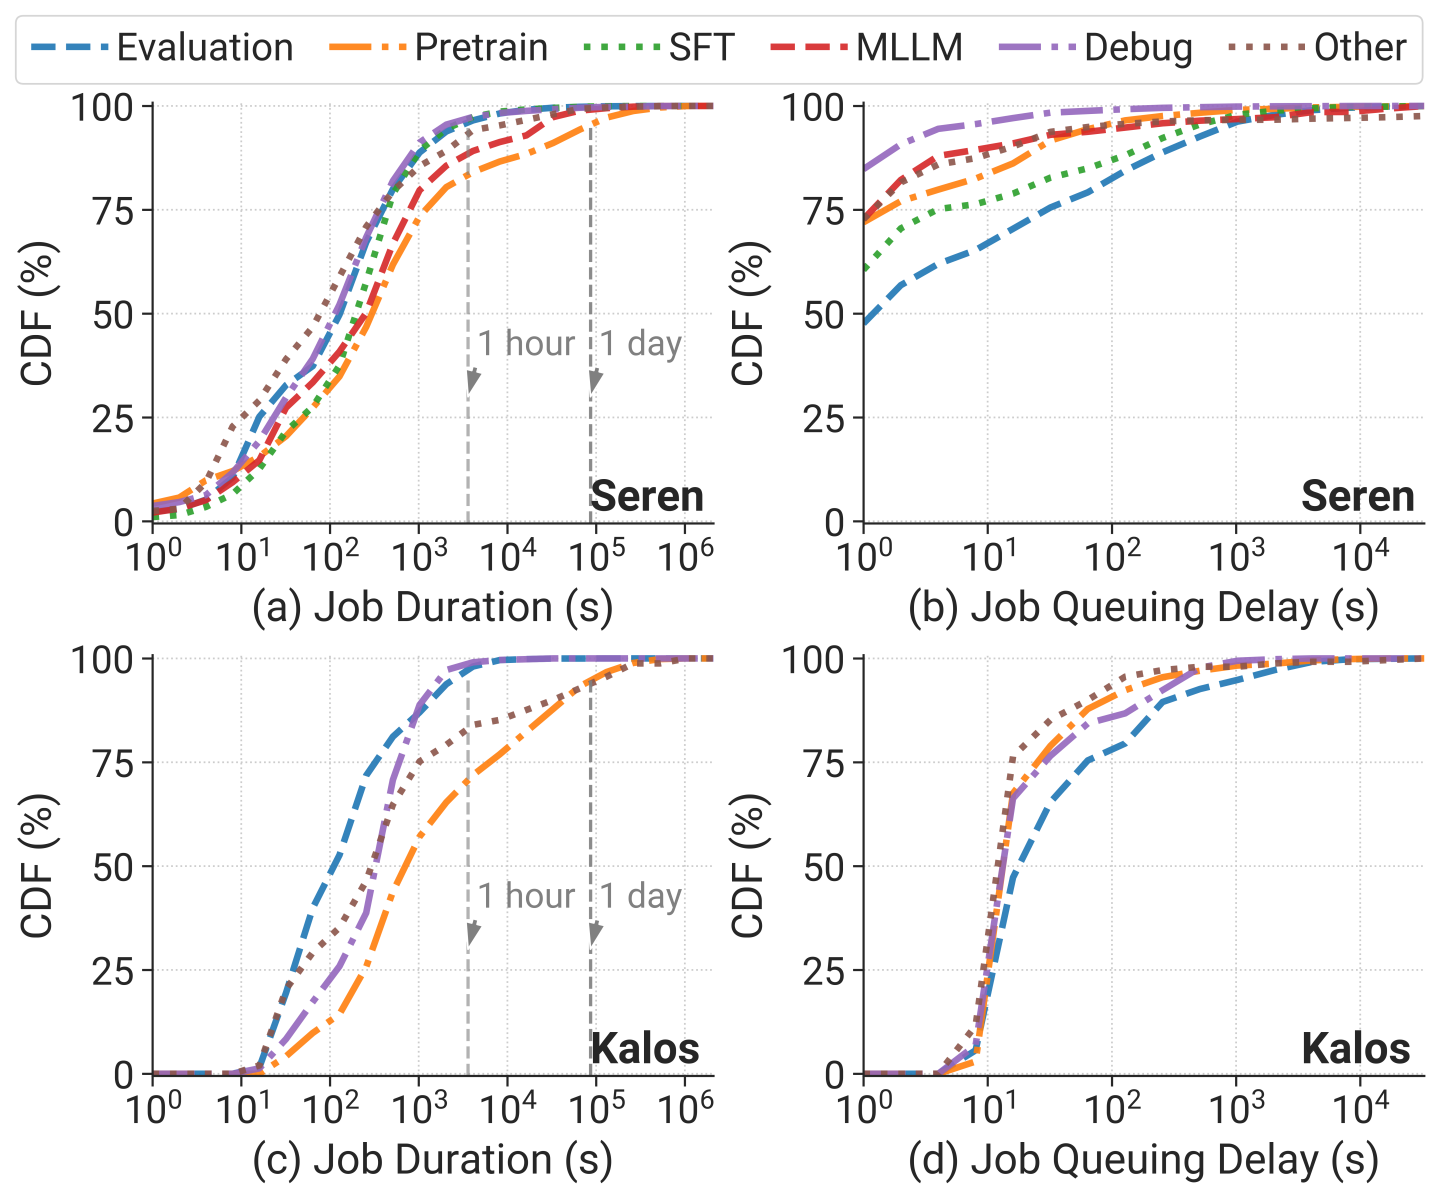
2. Similar Temporal Distribution. Figure 5 shows the distribution of job duration and queuing delay across different workloads. In terms of job duration, although pretraining jobs have the longest duration, they surpass other workloads within an order of magnitude in the median, and less than 5% of jobs last for over 1 day in both clusters. This can be attributed to frequent failures during pretraining.
Regarding job queuing delay, contrary to previous reports [5], [6], [7] suggesting that larger-scale jobs experience longer wait times, we observe that evaluation jobs have the longest queuing delay despite having the lowest GPU demands and shortest job duration. This discrepancy is due to the majority of resources being reserved for pretraining jobs to minimize their queuing delays. Evaluation jobs are typically submitted as a batch simultaneously with lower priority, utilizing the limited spare resources.
We further conduct fine-grained analysis for pretraining jobs, as they are the most resource-intensive workloads. To enhance training efficiency, our pretraining framework, InternEvo [8], undergoes continuous refinement and iteration in its system design. As presented in Figure 6, the initial version of InternEvo (adopted by our early jobs) is denoted as (a) primarily utilizes 3D parallelism akin to that of NVIDIA MegatronLM [3], and (b) employs a hierarchical ZeRO mechanism [8] that implements selective redundant sharding of model states, achieving optimal trade-off between communication overhead and GPU memory footprint.
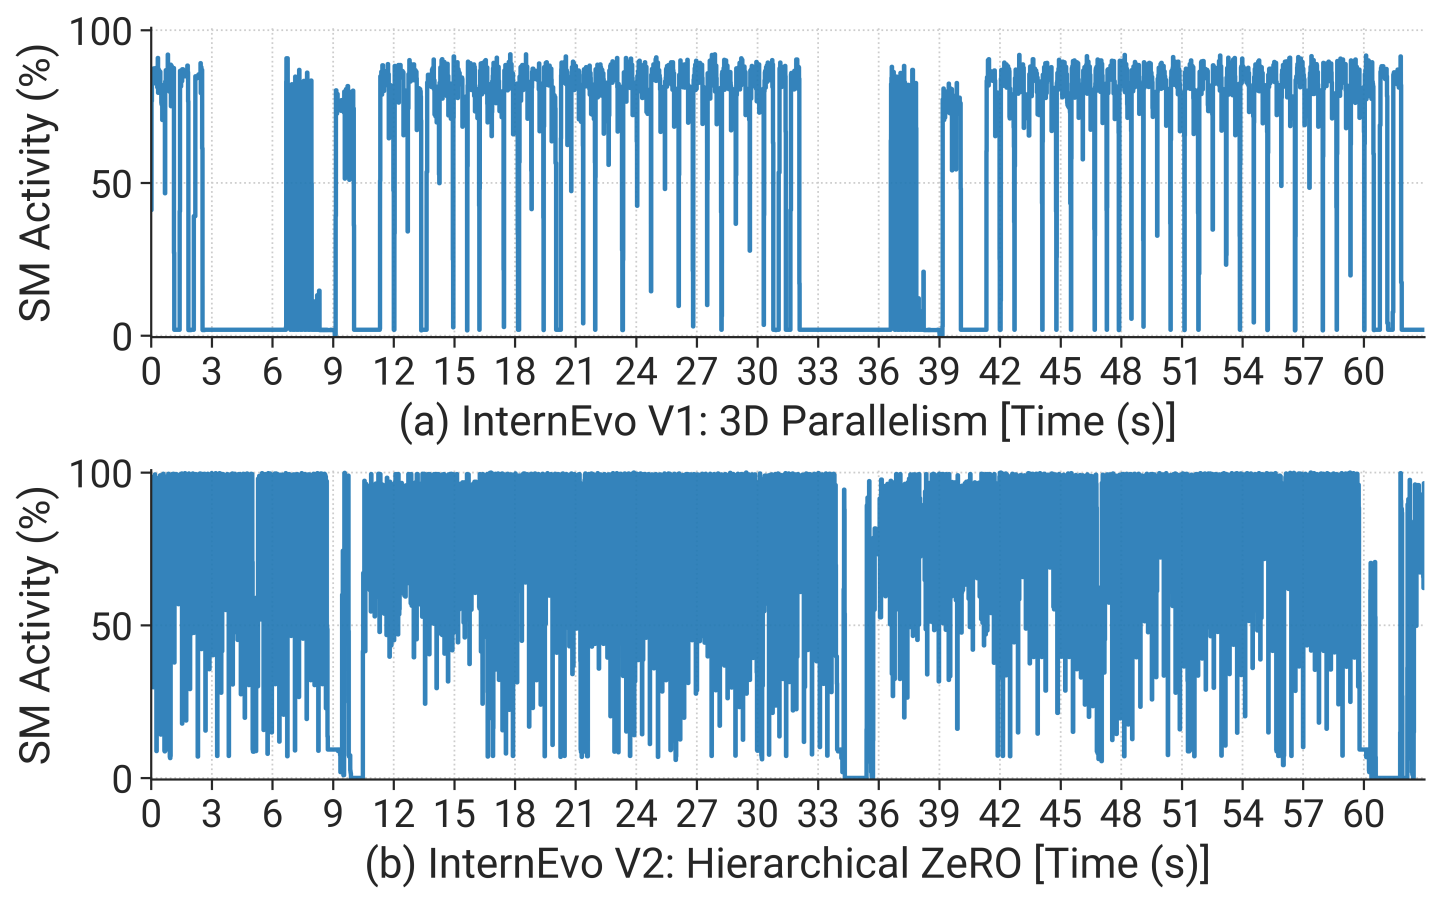
To provide a detailed example, we profile an LLM with 123 billion parameters across 2048 GPUs. Figure 5 illustrates the GPU SM (Streaming Multiprocessor) utilization for the same LLM under various training strategies. Both versions maintain the same global batch size and are optimized according to their respective configurations. It is evident that InternEvo V2 presents superior peak SM utilization and exhibits reduced idle periods compared to InternEvo V1, achieving around 16% acceleration. The relatively low utilization of 3D parallelism is mainly due to the impact of communication introduced by hybrid parallelism on the critical path, such as bubbles in pipeline parallelism. Note that the different inter- and intra-node communication hardware settings may lead to different optimal configurations.
To understand the root cause of failures, we conduct a comprehensive analysis of job errors, primarily relying on runtime logs and hardware monitor data from our two clusters.
Basically, they can be classified into three categories as follows. Note that these classifications may overlap, and the primary criterion for classifying a specific type of error is its most frequent occurrence.
- Infrastructure. Infrastructure-related failures arise from issues within the underlying computational platform or remote storage.
- Framework. Framework errors can be associated with tensor operations, shapes, data types, or unexpected behaviors. They are often observed in the initial phases of jobs and are typically resolved by fixing the configurations.
- Script. Script errors typically stem from programming errors or user oversights. They constitute the majority of failures and are often addressed by revising codes.
| Category | Reason | Num | Avg. GPU Demands | Avg. Time to Failure (mins) | Total % |
|---|---|---|---|---|---|
| Infrastructure | NVLinkError | 54 | 800 | 868.1 | 30.25% |
| CUDAError | 21 | 847 | 923.2 | 15.77% | |
| NodeFailure | 16 | 712 | 1288.8 | 14.30% | |
| ECCError | 12 | 680 | 1303.4 | 11.00% | |
| NetworkError | 12 | 758 | 549.6 | 4.53% | |
| ConnectionError | 147 | 29 | 51.9 | 3.44% | |
| S3StorageError | 10 | 422 | 2317.8 | 2.12% | |
| NCCLTimeoutError | 6 | 596 | 159.7 | 0.50% | |
| NCCLRemoteError | 3 | 1152 | 50.5 | 0.15% | |
| Framework | DataloaderKilled | 6 | 445 | 1580.6 | 4.38% |
| AttributeError | 67 | 228 | 67.8 | 3.90% | |
| OutOfMemoryError | 14 | 572 | 323.8 | 3.28% | |
| RuntimeError | 65 | 441 | 66.4 | 1.72% | |
| AssertionError | 105 | 413 | 41.7 | 1.24% | |
| ValueError | 33 | 387 | 9.9 | 0.16% | |
| ZeroDivisionError | 5 | 499 | 14.5 | 0.03% | |
| ModelLoadingError | 104 | 8 | 2.6 | 0.00% | |
| DatasetLoadingError | 5 | 1 | 1.6 | 0.00% | |
| Script | FileNotFoundError | 568 | 21 | 14.2 | 2.83% |
| OSError | 266 | 8 | 9.6 | 0.28% | |
| TypeError | 620 | 18 | 0.9 | 0.06% | |
| NameError | 18 | 247 | 3.2 | 0.02% | |
| PermissionError | 7 | 438 | 4.3 | 0.01% | |
| ImportError | 111 | 93 | 1.1 | 0.01% | |
| KeyError | 260 | 7 | 3 | 0.01% | |
| SyntaxError | 10 | 391 | 0.7 | 0.00% | |
| ArgumentError | 3 | 344 | 0.7 | 0.00% | |
| CalledProcessError | 4 | 256 | 0.2 | 0.00% | |
| IndexError | 23 | 6 | 1.6 | 0.00% |
We highlight several key observations from our failure analysis.
1. Infrastructure Failures Cause Most Severe Impact. As shown in Table 2, jobs that fail because of infrastructure issues often use a substantial number of GPUs (GPU Demand). They take over 82% GPU resources (GPU Time) with only 11% failed job quantity (Num). Most of these jobs are long-term pretraining tasks that can experience hardware failures multiple times, such as issues with GPU (e.g., CUDAError, ECCError), NVLink, and network system (e.g., NCCLRemoteError, S3StorageError). Addressing these infrastructure failures requires meticulous diagnostic efforts to pinpoint the source of the problems, often leading to the maintenance or replacement of defective hardware, which results in significant restart costs.
2. Failures Caused by High Temperature. Another noteworthy observation is that training 7B models in Kalos tends to result in GPU overheating, which can cause NVLinkError or ECCError. This phenomenon is largely due to the highly optimized communication cost, resulting in an exceptionally low GPU idle rate. We observe that the overall temperature in the cluster server room increased by approximately 5°C when training these models. Besides, we find most of these jobs occurred in July 2023, which is the hottest month on record. This anomalous climate may be a potential cause of these failures, which is aligned with the finding recently reported by Microsoft [9]. Subsequently, our team enhanced the cooling capabilities of the cluster, leading to a significant reduction in the frequency of such failures.
In summary, we analyze LLM workloads and resource utilization in our datacenter Acme, revealing unique features and challenges of LLM development, such as resource inefficiencies and failure impacts. We believe that our lessons and insights have broad applicability and can well benefit subsequent research.
For more information on this work, such as our system optimization for pretraining and evaluation workloads, please refer to our publication: ‘Characterization of Large Language Model Development in the Datacenter’, in USENIX Symposium on Networked Systems Design and Implementation (NSDI) 2024 [10, Paper].


