5th USENIX Conference on File and Storage Technologies - Paper Pp. 31–45 of the Proceedings
A Five-Year Study of
File-System Metadata
Nitin Agrawal
University of Wisconsin, Madison
nitina@cs.wisc.edu
|
William
J. Bolosky, John R. Douceur, Jacob R. Lorch
Microsoft Research
{bolosky,johndo,lorch}@microsoft.com
|
Abstract:
For five years, we collected annual snapshots of file-system metadata from over 60,000 Windows PC file systems in a large corporation. In this paper, we use these snapshots to study temporal changes in file size, file age, file-type frequency, directory size, namespace structure, file-system population, storage capacity and consumption, and degree of file modification. We present a generative model that explains the namespace structure and the distribution of directory sizes. We find significant temporal trends relating to the popularity of certain file types, the origin of file content, the way the namespace is used, and the degree of variation among file systems, as well as more pedestrian changes in sizes and capacities. We give examples of consequent lessons for designers of file systems and related software.
1 Introduction
Every year from 2000 to 2004, we collected snapshots of metadata from over ten thousand file systems on the Windows desktop computers at Microsoft Corporation. We gathered this data by mass-emailing a scanning program to Microsoft's employees, and we had a 22% participation rate every year. Our resulting datasets contain metadata from 63,398 distinct file systems, 6457 of which provided snapshots in multiple years. This project was a longitudinal extension of an earlier study we performed in 1998 [9], which was an order of magnitude larger than any prior study of file-system metadata. Our earlier study involved a single capture of file-system metadata, and it focused on lateral variation among file systems at a moment in time. By contrast, the present study focuses on longitudinal changes in file systems over a five-year time span. In particular, we study temporal changes in the size, age, and type frequency of files; the size of directories; the structure of the file-system namespace; and various characteristics of file systems, including file and directory population, storage capacity, storage consumption, and degree of file modification. The contributions of this work are threefold. First, we contribute the collected data set, which we will sanitize and make available for general use later this year. This is the largest set of file-system metadata ever collected, and it spans the longest time period of any sizeable metadata collection. To obtain this data set, contact the Microsoft authors. Second, we contribute all of our research observations, including:
- The space used in file systems has increased over the course of
our study, not only because mean file size has increased (from
108 KB to 189 KB), but also because the number of files has
increased (from 30K to 90K).
- Eight file-name extensions account for over 35% of files, and
nine file-name extensions account for over 35% of the bytes in files.
The same sets of extensions have remained popular for many years.
- The fraction of file-system content created or modified locally
has decreased over time. In the first year of our study, the median
file system had 30% of its files created or modified locally, and four
years later this percentage was 22%.
- Directory size distribution has not notably changed over the
years of our study. In each year, directories have had very few
subdirectories and a modest number of entries. 90% of them have had two
or fewer subdirectories, and 90% of them have had 20 or fewer total
entries.
- The fraction of file system storage residing in the namespace
subtree meant for user documents and settings has increased in every
year of our study, starting at 7% and rising to 15%. The fraction
residing in the subtree meant for system files has also risen over the
course of our study, from 2% to 11%.
- File system capacity has increased dramatically during our study,
with median capacity rising from 5 GB to 40 GB. One might
expect this to cause drastic reductions in file system fullness, but
instead the reduction in file system fullness has been modest. Median
fullness has only decreased from 47% to 42%.
- Over the course of a single year, 80% of file systems become
fuller and 18% become less full.
Third, we contribute a generative, probabilistic model for how
directory
trees are created. Our model explains the distribution of directories
by
depth in the namespace tree, and it also explains the distribution of
the
count of subdirectories per directory. This is the first generative
model
that characterizes the process by which file-system namespaces are
constructed.
§2 describes the methodology of
our data collection,
analysis, and presentation. §3, §4,
and §5 present our findings on,
respectively, files,
directories, and space usage. §6
surveys related work,
and §7 summarizes and concludes.
2 Methodology
This section describes the methodology we applied to collecting,
analyzing,
and presenting the data.
We developed a simple program that traverses the directory tree of each
local,
fixed-disk file system mounted on a computer. The program records a
snapshot
of all metadata associated with each file or directory, including
hidden files
and directories. This metadata includes name, size, timestamps, and
attributes. The program also records the parent-child relationships of
nodes
in the namespace tree, as well as some system configuration
information. The
program records file names in an encrypted form. We wrote automated
tools
that decrypt the file names for computing aggregate statistics, but for
privacy reasons we do not look at the decrypted file names directly,
which
places some limits on our analyses. In post-processing, we remove
metadata
relating to the system paging file, because this is part of the virtual
memory
system rather than the file system.
In the autumn of every year from 2000 to 2004, we distributed the
scanning
program via email to a large subset of the employees of Microsoft, with
a
request for the recipients to run the program on their desktop
machines. As
an incentive to participate, we held a lottery in which each scanned
machine
counted as an entry, with a single prize of a night's stay at a nearby
resort
hotel. The specific subset of people we were permitted to poll varied
from
year to year based on a number of factors; however, despite variations
in user
population and in other distribution particulars, we observed a 22%
participation rate every year.
We scanned desktops rather than servers because at Microsoft, files
are
typically stored on individual desktops rather than centralized
servers. We
collected the data via voluntary participation rather than random
selection
because the company only permitted the former approach; note that this
voluntary approach may have produced selection bias.
Table 1 itemizes some
properties of each year's data
collection. The primary collection period ran between the listed start
and
end dates, which mark the beginning of our emailing requests and the
last
eligible day for the lottery. Some snapshots continued to trickle in
after
the primary collection period; we used these in our analyses as well.
Table 2 itemizes the breakdown
of each year's snapshots
according to file-system type. 80% of our snapshots came from
NTFS [27], the main file
system for operating systems in the
Windows NT family; 5% from FAT [18], a 16-bit file system dating
from DOS; and 15% from FAT32 [18],
a 32-bit upgrade of FAT
developed for Windows 95.
Table 1:
Properties of each year's dataset
| Year |
Period |
Users |
Machs |
FSs |
| 2000 |
13 Sep - 29 Sep |
5396 |
6051 |
11,654 |
| 2001 |
8 Oct - 2 Nov |
7539 |
9363 |
16,022 |
| 2002 |
30 Sep - 1 Nov |
7158 |
9091 |
15,011 |
| 2003 |
13 Oct - 14 Nov |
7436 |
9262 |
14,633 |
| 2004 |
5 Oct - 12 Nov |
7180 |
8729 |
13,505 |
|
Table 2:
File system types in datasets
| Year |
NTFS |
FAT32 |
FAT |
Other |
Total |
| 2000 |
7,015 |
2,696 |
1,943 |
0 |
11,654 |
| 2001 |
11,791 |
3,314 |
915 |
2 |
16,022 |
| 2002 |
12,302 |
2,280 |
429 |
0 |
15,011 |
| 2003 |
12,853 |
1,478 |
302 |
0 |
14,633 |
| 2004 |
12,364 |
876 |
264 |
1 |
13,505 |
| Total |
56,325 |
10,644 |
3,853 |
3 |
70,825 |
|
For some analyses, we needed a way to establish whether two file-system
snapshots from different years refer to the same file system.
``Sameness'' is
not actually a well-formed notion; for example, it is not clear whether
a file
system is still the same after its volume is extended. We defined two
snapshots to refer to the same file system if and only if they have the
same
user name, computer name, volume ID, drive letter, and total space. The
need
for some of these conditions was not obvious at first. For example, we
added
drive letter because some drives on some machines are multiply mapped,
and we
added total space so that a volume set would not be considered the same
if a
new volume were added to the set. Based on this definition,
Table 3 shows the number
of snapshots for which
we have consecutive-year information.
Table 3:
Number of file systems for which we have snapshots in the  consecutive years starting with each year. For instance,
there are 1,852 file systems for which we have snapshots from both 2002
and 2003. consecutive years starting with each year. For instance,
there are 1,852 file systems for which we have snapshots from both 2002
and 2003.
| Start |
1 |
2 |
3 |
4 |
5 |
| 2000 |
11,654 |
950 |
234 |
63 |
18 |
| 2001 |
16,022 |
1,833 |
498 |
144 |
- |
| 2002 |
15,011 |
1,852 |
588 |
- |
- |
| 2003 |
14,633 |
1,901 |
- |
- |
- |
| 2004 |
13,505 |
- |
- |
- |
- |
| Total |
70,825 |
6,536 |
1,320 |
207 |
18 |
|
Many of our graphs have horizontal axes that span a large range of
nonnegative
numbers. To represent these ranges compactly, we use a logarithmic
scale for
non-zero values, but we also include an abscissa for the zero value,
even
though zero does not strictly belong on a logarithmic scale.
We plot most histograms with line graphs rather than bar graphs
because, with
five or more datasets on a single plot, bar graphs can become difficult
to
read. For each bin in the histogram, we plot a point  where where  is
the midpoint of the bin and is
the midpoint of the bin and  is the size of the
bin. We use the geometric
midpoint when the axis uses a logarithmic scale. We
often plot
un-normalized histograms rather than probability density functions
(PDFs) for
two reasons: First, the graphs expose more data if we do not normalize
them.
Second, because the count of files and directories per file system has
grown
substantially over time, not normalizing allows us to plot multiple
years'
curves on the same chart without overlapping to the point of
unreadability. is the size of the
bin. We use the geometric
midpoint when the axis uses a logarithmic scale. We
often plot
un-normalized histograms rather than probability density functions
(PDFs) for
two reasons: First, the graphs expose more data if we do not normalize
them.
Second, because the count of files and directories per file system has
grown
substantially over time, not normalizing allows us to plot multiple
years'
curves on the same chart without overlapping to the point of
unreadability.
Whenever we use the prefix K, as in KB, we mean  .
Similarly, we use M
for .
Similarly, we use M
for  and G for and G for  . .
We believe that analysis of longitudinal file system data is of
interest to
many sets of people with diverse concerns about file system usage. For
instance:
- developers of file systems, including desktop, server, and
distributed file systems
- storage area network designers
- developers of file system utilities, such as backup, anti-virus,
content indexing, encryption, and disk space usage visualization
- storage capacity planners
- disk manufacturers, especially those using gray-box techniques to
enable visibility into the file system at the disk level [2]
- multitier storage system developers
In each subsection, after discussing our findings and what we consider
to be
the most interesting summaries of these findings, we will present some
examples of interesting implications for the people enumerated above.
All our data comes from a relatively homogenous sample of machines:
Microsoft
desktops running Windows. Since past studies [23,28]
have
shown that file system characteristics can vary from one environment to
another, our conclusions may not be applicable to substantially
different
environments. For instance, our conclusions are likely not applicable
to file
system server workloads, and it is unclear to what extent they can be
generalized to non-Windows operating systems. It may also be that
artifacts
of Microsoft policy, such as specific software distributions that are
common
or disallowed, may yield results that would not apply to other
workloads.
3 Files
3.1 File count per file system
Figure 1:
CDFs of file systems by file count
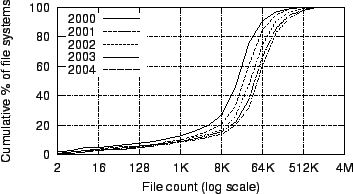 |
Figure 1
plots cumulative
distribution functions (CDFs) of file systems by count of files. The
count of
files per file system has increased steadily over our five-year sample
period:
The arithmetic mean has grown from 30K to 90K files and the median has
grown
from 18K to 52K files.
The count of files per file system is going up from year to year,
and, as we
will discuss in §4.1,
the same holds
for directories. Thus, file system designers should ensure their
metadata
tables scale to large file counts. Additionally, we can expect file
system
scans that examine data proportional to the number of files and/or
directories
to take progressively longer. Examples of such scans include virus
scans and
metadata integrity checks following block corruption. Thus, it will
become
increasingly useful to perform these checks efficiently, perhaps by
scanning
in an order that minimizes movement of the disk arm.
This section describes our findings regarding file size. We report the
size
of actual content, ignoring the effects of internal fragmentation, file
metadata, and any other overhead. We observe that the overall file size
distribution has changed slightly over the five years of our study. By
contrast, the majority of stored bytes are found in increasingly larger
files.
Moreover, the latter distribution increasingly exhibits a double mode,
due
mainly to database and blob (binary large object) files.
Figure 2:
Histograms of files by size
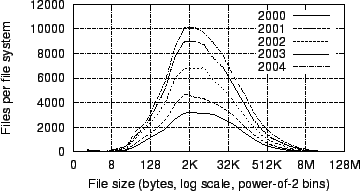 |
Figure 3:
CDFs of files by size
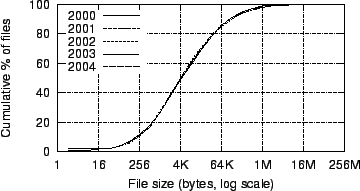 |
Figure 2 plots
histograms of files by size
and Figure 3 plots the
corresponding CDFs. We
see that the absolute count of files per file system has grown
significantly
over time, but the general shape of the distribution has not changed
significantly. Although it is not visible on the graph, the arithmetic
mean
file size has grown by 75% from 108 KB to 189 KB. In each
year, 1-1.5% of
files have a size of zero.
The growth in mean file size from 108 KB to 189 KB over
four years suggests
that this metric grows roughly 15% per year. Another way to estimate
this
growth rate is to compare our 2000 result to the 1981 result of
13.4 KB
obtained by Satyanarayanan [24].
This comparison estimates the
annual growth rate as 12%. Note that this latter estimate is somewhat
flawed, since it compares file sizes from two rather different
environments.
Figure 4:
Histograms of bytes by containing file
size
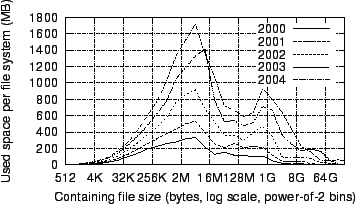 |
Figure 5:
CDFs of bytes by containing file
size
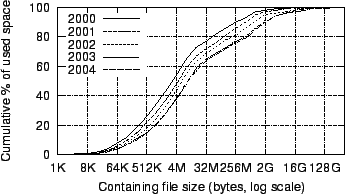 |
Figure 4
plots histograms
of bytes by containing file size, alternately described as histograms
of files
weighted by file size. Figure 5
plots CDFs of these distributions. We observe that the distribution of
file
size has shifted to the right over time, with the median weighted file
size increasing
from 3 MB to 9 MB. Also, the distribution exhibits a double
mode that has
become progressively more pronounced. The corresponding distribution in
our
1998 study did not show a true second mode, but it did show an
inflection
point around 64 MB, which is near the local minimum in
Figure 4.
Figure 6:
Contribution of file types to Figure 4 (2004). Video
means files with extension avi, dps, mpeg,
mpg, vob, or wmv; DB means files
with extension ldf, mad, mdf, ndf,
ost, or pst; and Blob means files named hiberfil.sys
and files with extension bak, bkf, bkp, dmp,
gho, iso, pqi, rbf, or vhd.
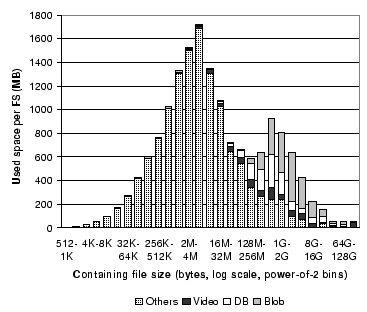 |
To study this second peak, we broke out several categories of files
according
to file-name extension.
Figure 6
replots the 2004 data from
Figure 4
as a stacked bar
chart, with the contributions of video, database, and blob files
indicated.
We see that most of the bytes in large files are in video, database,
and blob
files, and that most of the video, database, and blob bytes are in
large
files.
Our finding that different types of files have different size
distributions
echoes the findings of other studies. In 1981, Satyanarayanan [24]
found this to be the case on a shared file server in an academic
environment.
In 2001, Evans and Kuenning also noted this phenomenon in their
analysis of 22
machines running various operating systems at Harvey Mudd College and
Marine
Biological Laboratories [11].
The fact that this finding is
consistent across various different environments and times suggests
that it is
fundamental.
There are several implications of the fact that a large number of
small files
account for a small fraction of disk usage, such as the following.
First, it
may not take much space to colocate many of these files with their
metadata.
This may be a reasonable way to reduce the disk seek time needed to
access
these files. Second, a file system that colocates several files in a
single
block, like ReiserFS [22],
will have many opportunities to do so.
This will save substantial space by eliminating internal fragmentation,
especially if a large block size is used to improve performance. Third,
designers of disk usage visualization utilities may want to show not
only
directories but also the names of certain large files.
This subsection describes our findings regarding file age. Because file
timestamps can be modified by application programs [17], our
conclusions should be regarded cautiously.
Figure 7:
Histograms of files by age
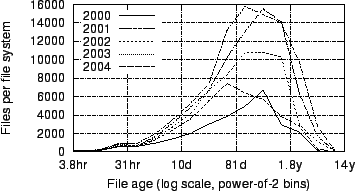 |
Figure 8:
CDFs of files by age
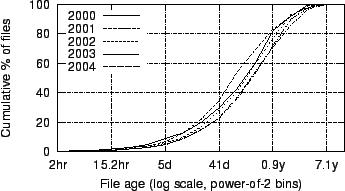 |
Figure 7 plots
histograms of files by age,
calculated as the elapsed time since the file was created or last
modified,
relative to the time of the snapshot. Figure 8
shows CDFs of this same data. The median file age ranges between 80 and
160
days across datasets, with no clear trend over time.
The distribution of file age is not memoryless, so the age of a file
is useful
in predicting its remaining lifetime. So, systems such as archival
backup
systems can use this distribution to make predictions of how much
longer a
file will be needed based on how old it is. Since the distribution of
file
age has not appreciably changed across the years, we can expect that a
prediction algorithm developed today based on the latest distribution
will
apply for several years to come.
This subsection describes our findings regarding popular file types, as
determined by file-name extension. Although the top few extensions have
not
changed dramatically over our five-year sample period, there has been
some
change, reflecting a decline in the relative prevalence of web content
and an
increase in use of virtual machines. The top few extensions account for
nearly half of all files and bytes in file systems.
In old DOS systems with 8.3-style file names, the extension was the
zero to
three characters following the single dot in the file name. Although
Windows
systems allow file names of nearly arbitrary length and containing
multiple
dots, many applications continue to indicate their file types by means
of
extensions. For our analyses, we define an extension as the
five-or-fewer
characters following the last dot in a file name. If a name has no dots
or
has more than five characters after the last dot, we consider that name
to
have no extension, which we represent with the symbol Ø. As a
special case,
if a file name ends in .gz, .bz2, and .Z,
then we
ignore that suffix when determining extension. We do this because these
are
types of compressed files wherein the actual content type is indicated
by the
characters prior to the compression extension. To understand the
typical
usage of the file extensions we discuss in this section, see
Table 4.
Table 4:
Typical usage of popular file extensions
| Extension |
Typical Usage |
| cpp |
C++ source code |
| dll |
Dynamic link library |
| exe |
Executable |
| gif |
Image in Graphic Interchange Format |
| h |
Source code header |
| htm |
File in hypertext markup language |
| jpg |
Image in JPEG format |
| lib |
Code library |
| mp3 |
Music file in MPEG Layer III format |
| pch |
Precompiled header |
| pdb |
Source symbols for debugging |
| pst |
Outlook personal folder |
| txt |
Text |
| vhd |
Virtual hard drive for virtual machine |
| wma |
Windows Media Audio |
|
Figure 9:
Fraction of files with popular extensions
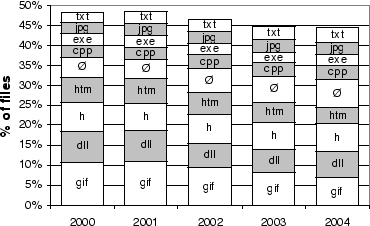 |
Figure 10:
Fraction of bytes in files with popular extensions
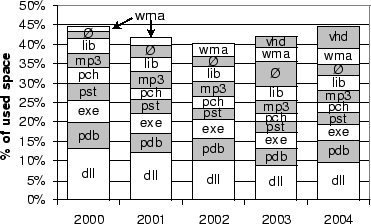 |
Figure 9
plots, for the nine
extensions that are the most popular in terms of file count, the
fraction of
files with that extension. The fractions are plotted longitudinally
over our
five-year sample period. The most notable thing we observe is that
these
extensions' popularity is relatively stable--the top five extensions
have
remained the top five for this entire time. However, the relative
popularity
of gif files and htm files has gone down steadily
since
2001, suggesting a decline in the popularity of web content relative to
other
ways to fill one's file system.
Figure 10
plots, for
the ten extensions that are the most popular in terms of summed file
size, the
fraction of file bytes residing in files with that extension. Across
all
years, dynamic link libraries (dll files) contain more bytes
than any
other file type. Extension vhd, which is used for virtual
hard
drives, is consuming a rapidly increasing fraction of file-system
space,
suggesting that virtual machine use is increasing. The null extension
exhibits a notable anomaly in 2003, but we cannot investigate the cause
without decrypting the file names in our datasets, which would violate
our
privacy policy.
Since files with the same extension have similar properties and
requirements,
some file system management policies
can be improved by including special-case treatment for particular
extensions.
Such special-case treatment can be built into the file system or
autonomically
and dynamically learned [16].
Since nearly half the files, and
nearly half the bytes, belong to files with a few popular extensions,
developing such special-case treatment for only a few particular
extensions
can optimize performance for a large fraction of the file system.
Furthermore, since the same extensions continue to be popular year
after year,
one can develop special-case treatments for today's popular extensions
and
expect that they will still be useful years from now.
Figure 11:
Histograms of file systems by percentage of files unwritten
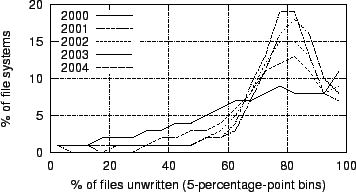 |
Figure 12:
CDFs of file systems by percentage of files unwritten
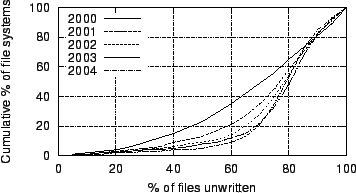 |
Figures 11
and 12
plot histograms and CDFs,
respectively, of file systems by percentage of files that have not been
written since they were copied onto the file system. We identify such
files
as ones whose modification timestamps are earlier than their creation
timestamps, since the creation timestamp of a copied file is set to the
time
at which the copy was made, but its modification timestamp is copied
from the
original file. Over our sample period, the arithmetic mean of the
percentage
of locally unwritten files has grown from 66% to 76%, and the median
has
grown from 70% to 78%. This suggests that users locally contribute to a
decreasing fraction of their systems' content. This may in part be due
to the
increasing amount of total content over time.
Since more and more files are being copied across file systems
rather than
generated locally, we can expect identifying and coalescing identical
copies
to become increasingly important in systems that aggregate file
systems.
Examples of systems with such support are the FARSITE distributed file
system [1], the Pastiche
peer-to-peer backup system [8],
and the Single Instance Store in Windows file servers [5].
4 Directories
4.1 Directory count per file system
Figure 13:
CDFs of file systems by directory count
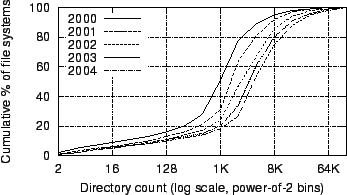 |
Figure 13
plots CDFs of file
systems by count of directories. The count of directories per file
system has
increased steadily over our five-year sample period: The arithmetic
mean has
grown from 2400 to 8900 directories and the median has grown from 1K to
4K
directories.
We discussed implications of the rising number of directories per
file system
earlier, in §3.1.
This section describes our findings regarding directory size, measured
by
count of contained files, count of contained subdirectories, and total
entry
count. None of these size distributions has changed appreciably over
our
sample period, but the mean count of files per directory has decreased
slightly.
Figure 14:
CDFs of directories by file
count
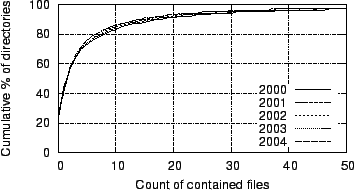 |
Figure 15:
CDFs of directories by subdirectory
count
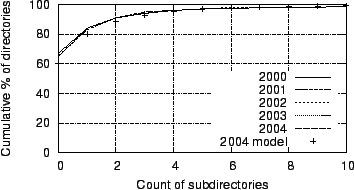 |
Figure 16:
CDFs of directories by entry
count
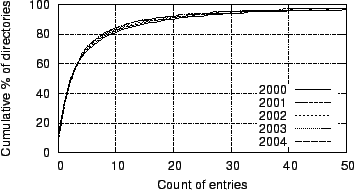 |
Figure 14
plots CDFs of directories
by size, as measured by count of files in the directory. It shows that
although the absolute count of directories per file system has grown
significantly over time, the distribution has not changed appreciably.
Across
all years, 23-25% of directories contain no files, which marks a change
from
1998, in which only 18% contained no files and there were more
directories
containing one file than those containing none. The arithmetic mean
directory
size has decreased slightly and steadily from 12.5 to 10.2 over the
sample
period, but the median directory size has remained steady at
2 files.
Figure 15
plots CDFs of
directories by size, as measured by count of subdirectories in the
directory.
It includes a model approximation we will discuss later in
§4.5. This distribution
has remained unchanged
over our sample period. Across all years, 65-67% of directories contain
no
subdirectories, which is similar to the 69% found in 1998.
Figure 16
plots CDFs of directories
by size, as measured by count of total entries in the directory. This
distribution has remained largely unchanged over our sample period.
Across
all years, 46-49% of directories contain two or fewer entries.
Since there are so many directories with a small number of files, it
would not
take much space to colocate the metadata for most of those files with
those
directories. Such a layout would reduce seeks associated with file
accesses.
Therefore, it might be useful to preallocate a small amount of space
near a
new directory to hold a modest amount of child metadata. Similarly,
most
directories contain fewer than twenty entries, suggesting using an
on-disk
structure for directories that optimizes for this common case.
4.3 Special directories
This section describes our findings regarding the usage of Windows
special
directories. We find that an increasing fraction of file-system storage
is in
the namespace subtree devoted to system files, and the same holds for
the
subtree devoted to user documents and settings.
Figure 17:
Fraction of files and bytes in special
subtrees
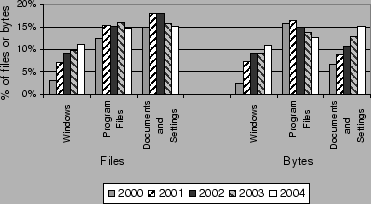 |
Figure 17
plots the fraction of
file-system files that reside within subtrees rooted in each of three
special
directories: Windows, Program Files, and Documents
and Settings. This figure also plots the fraction of file-system
bytes
contained within each of these special subtrees.
For the Windows subtree, the fractions of files and bytes
have both
risen from 2-3% to 11% over our sample period, suggesting that an
increasingly large fraction of file-system storage is devoted to system
files.
In particular, we note that Windows XP was released between the
times of our
2000 and 2001 data collections.
For the Program Files subtree, the fractions of files and
bytes have
trended in opposite directions within the range of 12-16%. For the
Documents and Settings subtree, the fraction of bytes has
increased
dramatically while the fraction of files has remained relatively
stable.
The fraction of all files accounted for by these subtrees has risen
from 25%
to 40%, and the fraction of bytes therein has risen from 30% to 41%,
suggesting that application writers and end users have increasingly
adopted
Windows' prescriptive namespace organization [7].
Backup software generally does not have to back up system files,
since they
are static and easily restored. Since system files are accounting for a
larger and larger fraction of used space, it is becoming more and more
useful
for backup software to exclude these files.
On the other hand, files in the Documents and Settings folder tend
to be the
most important files to back up, since they contain user-generated
content and
configuration information. Since the percentage of bytes devoted to
these
files is increasing, backup capacity planners should expect,
surprisingly,
that their capacity requirements will increase faster than disk
capacity is planned to grow. On the other hand, the percentage of files
is
not increasing, so they need not expect metadata storage requirements
to scale
faster than disk capacity. This may be relevant if metadata is backed
up in a
separate repository from the data, as done by systems such as EMC
Centera [13].
4.4 Namespace tree depth
This section describes our findings regarding the depth of directories,
files,
and bytes in the namespace tree. We find that there are many files deep
in
the namespace tree, especially at depth 7. Also, we find that files
deeper in
the namespace tree tend to be orders-of-magnitude smaller than
shallower
files.
Figure 18:
Histograms of directories by namespace
depth
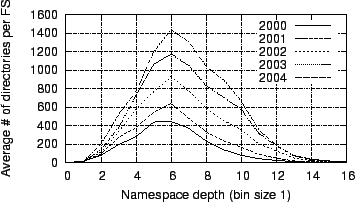 |
Figure 19:
CDFs of directories by namespace
depth
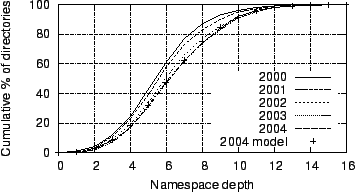 |
Figure 18
plots histograms
of directories by their depth in the namespace tree, and
Figure 19
plots CDFs of this
same data; it also includes a model approximation we will discuss later
in
§4.5. The general shape
of the distribution has
remained consistent over our sample period, but the arithmetic mean has
grown
from 6.1 to 6.9, and the median directory depth has increased from 5 to
6.
Figure 20:
Histograms of files by namespace
depth
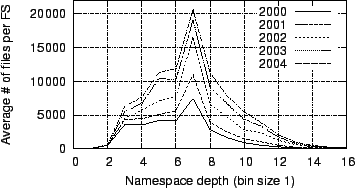 |
Figure 21:
CDFs of files by namespace
depth
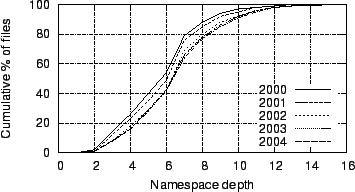 |
Figure 20
plots histograms of
file count by depth in the namespace tree, and
Figure 21
plots CDFs of this same
data. With a few exceptions, such as at depths 2, 3, and 7, these
distributions roughly track the observed distributions of directory
depth,
indicating that the count of files per directory is mostly independent
of
directory depth. To study this more directly,
Figure 22
plots the mean count
of files per directory versus directory depth. There is a slight
downward
trend in this ratio with increasing depth, punctuated by three depths
whose
directories have greater-than-typical counts of files: At depth 2 are
files in
the Windows and Program Files directories; at depth
3 are
files in the System and System32 directories; and
at depth 7
are files in the web cache directories.
Figure 22:
Files per directory vs. namespace depth
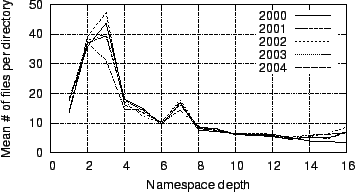 |
Figure 23:
File size vs. namespace depth
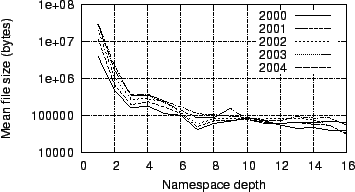 |
Figure 23 plots
the mean file size versus
directory depth on a logarithmic scale. We see here that files deeper
in the
namespace tree tend to be smaller than shallower ones. The mean file
size
drops by two orders of magnitude between depth 1 and depth 3,
and there is a
drop of roughly 10% per depth level thereafter. This phenomenon occurs
because most bytes are concentrated in a small number of large files
(see
Figures 2
and 4),
and these files
tend to reside in shallow levels of the namespace tree. In particular,
the
hibernation image file is located in the root.
Since many files and directories are deep in the namespace tree,
efficient
path lookup of deep paths should be a priority for file system
designers. For
instance, in distributed file systems where different servers are
responsible
for different parts of the namespace tree [1], deep path lookup may
be expensive if not optimized. The high depth of many entries in the
namespace may also be of interest to designers of file system
visualization
GUIs, to determine how much column space to allot for directory
traversal.
Furthermore, since the fraction of files at high depths is increasing
across
the years of our study, these lessons will become more and more
important as
years pass.
The clear trend of decreasing file size with increasing namespace
tree depth
sugests a simple coarse mechanism to predict future file size at time
of file
creation. File systems might use such prediction to decide where on
disk to
place a new file.
4.5 Namespace depth model
We have developed a generative model that accounts for the distribution
of
directory depth. The model posits that new subdirectories are created
inside
an existing directory in offset proportion to the count of
subdirectories
already in that directory.
In our previous study [9],
we observed that the distribution of
directories by depth could be approximated by a Poisson distribution
with
 , yielding a maximum displacement of cumulative curves
(MDCC)
of 2%. Poisson is also an acceptable approximation for the five
datasets in
the present study, with , yielding a maximum displacement of cumulative curves
(MDCC)
of 2%. Poisson is also an acceptable approximation for the five
datasets in
the present study, with  growing from 6.03 to
6.88 over the sample
period, yielding MDCCs that range from 1% to 4%. However, the Poisson
distribution does not provide an explanation for the behavior; it
merely
provides a means to approximate the result. By contrast, we have
developed a
generative model that accounts for the distribution of directory depths
we
have observed, with accuracy comparable to the Poisson model. growing from 6.03 to
6.88 over the sample
period, yielding MDCCs that range from 1% to 4%. However, the Poisson
distribution does not provide an explanation for the behavior; it
merely
provides a means to approximate the result. By contrast, we have
developed a
generative model that accounts for the distribution of directory depths
we
have observed, with accuracy comparable to the Poisson model.
The generative model is as follows. A file system begins with an
empty root
directory. Directories are added to the file system one at a time. For
each
new directory, a parent directory is selected probabilistically, based
on the
count of subdirectories the parent currently has. Specifically, the
probability of choosing each extant directory as a parent is
proportional to
 , where , where  is the count of
extant subdirectories of directory is the count of
extant subdirectories of directory
 . We used Monte Carlo simulation to compute directory depth
distributions
according to this generative model. Given a count of directories in a
file
system, the model produces a distribution of directory depths that
matches the
observed distribution for file systems of that size.
Figure 19
plots the aggregate
result of the model for all file systems in the 2004 dataset. The model
closely matches the CDF of observed directory depths, with an MDCC of
1%. . We used Monte Carlo simulation to compute directory depth
distributions
according to this generative model. Given a count of directories in a
file
system, the model produces a distribution of directory depths that
matches the
observed distribution for file systems of that size.
Figure 19
plots the aggregate
result of the model for all file systems in the 2004 dataset. The model
closely matches the CDF of observed directory depths, with an MDCC of
1%.
Our generative model accounts not only for the distribution of
directory depth
but also for that of subdirectory size.
Figure 15
shows this for the
2004 dataset. The model closely matches the CDF, with an MDCC of 5%.
Intuitively, the proportional probability
can be interpreted as
follows: If a directory already has some subdirectories, it has
demonstrated
that it is a useful location for subdirectories, and so it is a likely
place
for more subdirectories to be created. The more subdirectories it has,
the
more demonstrably useful it has been as a subdirectory home, so the
more
likely it is to continue to spawn new subdirectories. If the
probability were
proportional to without any offset, then an empty
directory could never
become non-empty, so some offset is necessary. We found an offset of 2
to
match our observed distributions very closely for all five years of our
collected data, but we do not understand why the particular value of 2
should
be appropriate.
5 Space Usage
Figure 24:
CDFs of file systems by storage capacity
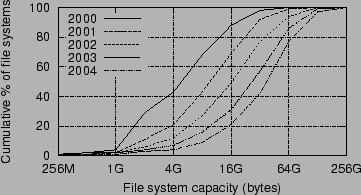 |
Figure 24
plots CDFs of file
system volumes by storage capacity, which has increased dramatically
over our
five-year sample period: The arithmetic mean has grown from 8 GB
to 46 GB and
the median has grown from 5 GB to 40 GB. The number of
small-capacity file
system volumes has dropped dramatically: Systems of 4 GB or less
have gone
from 43% to 4% of all file systems.
Figure 25:
CDFs of file systems by total consumed space
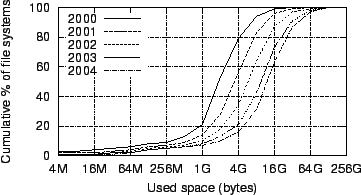 |
Figure 25
plots CDFs of
file systems by total consumed space, including not only file content
but also
space consumed by internal fragmentation, file metadata, and the system
paging
file. Space consumption increased steadily over our five-year sample
period:
The geometric mean has grown from 1 GB to 9 GB, the
arithmetic mean has grown
from 3 GB to 18 GB, and the median has grown from 2 GB
to 13 GB.
Figure 26:
CDFs of file systems by fullness
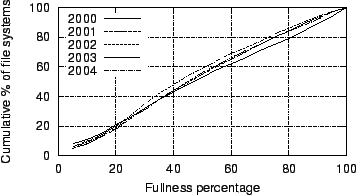 |
Figure 26
plots CDFs of file systems
by percentage of fullness, meaning the consumed space relative to
capacity.
The distribution is very nearly uniform for all years, as it was in our
1998
study. The mean fullness has dropped slightly from 49% to 45%, and the
median file system has gone from 47% full to 42% full. By contrast, the
aggregate fullness of our sample population, computed as total consumed
space
divided by total file-system capacity, has held steady at 41% over all
years.
In any given year, the range of file system capacities in this
organization is
quite large. This means that software must be able to accommodate a
wide
range of capacities simultaneously existing within an organization. For
instance, a peer-to-peer backup system must be aware that some machines
will
have drastically more capacity than others. File system designs, which
must
last many years, must accommodate even more dramatic capacity
differentials.
5.2 Changes in usage
This subsection describes our findings regarding how individual file
systems
change in fullness over time. For this part of our work, we examined
the 6536
snapshot pairs that correspond to the same file system in two
consecutive
years. We also examined the 1320 snapshot pairs that correspond to the
same
file system two years apart. We find that 80% of file systems become
fuller
over a one-year period, and the mean increase in fullness is 14
percentage
points. This increase is predominantly due to creation of new files,
partly
offset by deletion of old files, rather than due to extant files
changing
size.
When comparing two matching snapshots in different years, we must
establish
whether two files in successive snapshots of the same file system are
the same
file. We do not have access to files' inode numbers, because collecting
them
would have lengthened our scan times to an unacceptable degree. We thus
instead use the following proxy for file sameness: If the files have
the same
full pathname, they are considered the same, otherwise they are not.
This is
a conservative approach: It will judge a file to be two distinct files
if it
or any ancestor directory has been renamed.
Figure 27:
Histograms of file systems by 1-year fullness increase
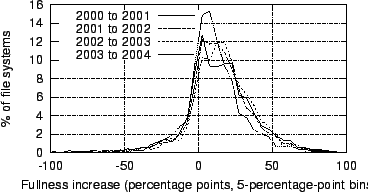 |
Figure 28:
CDFs of file systems by 1-year fullness increase
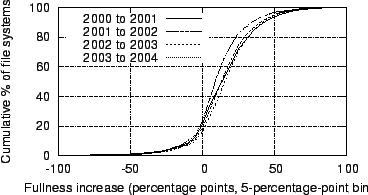 |
Figures 27
and 28
plot histograms and
CDFs, respectively, of file systems by percentage-point increase in
fullness
from one year to the next. We define this term by example: If a file
system
was 50% full in 2000 and 60% full in 2001, it exhibited a 10
percentage-point increase in fullness. The distribution is
substantially the
same for all four pairs of consecutive years.
Figure 28
shows that
80% of file systems exhibit an increase in fullness and fewer than 20%
exhibit a decrease. The mean increase from one year to the next is 14
percentage points.
We also examined the increase in fullness over two years. We found
the mean
increase to be 22 percentage points. This is less than twice the
consecutive-year increase, indicating that as file systems age, they
increase
their fullness at a slower rate. Because we have so few file systems
with
snapshots in four consecutive years, we did not explore increases over
three
or more years.
Since file systems that persist for a year tend to increase their
fullness by
about 14 points, but the mean file-system fullness has dropped from 49%
to
45% over our sample period, it seems that the steadily increasing
fullness of
individual file systems is offset by the replacement of old file
systems with
newer, emptier ones.
Analyzing the factors that contribute to the 14-point mean
year-to-year
increase in fullness revealed the following breakdown: Fullness
increases by
28 percentage points due to files that are present in the later
snapshot but
not in the earlier one, meaning that they were created during the
intervening
year. Fullness decreases by 15 percentage points due to files that are
present in the earlier snapshot but not in the later one, meaning that
they
were deleted during the intervening year. Fullness also increases by 1
percentage point due to growth in the size of files that are present in
both
snapshots. An insignificant fraction of this increase is attributable
to
changes in system paging files, internal fragmentation, or metadata
storage.
We examined the size distributions of files that were created and of
files
that were deleted, to see if they differed from the overall file-size
distribution. We found that they do not differ appreciably. We had
hypothesized that users tend to delete large files to make room for new
content, but the evidence does not support this hypothesis.
Since deleted files and created files have similar size
distributions, file
system designers need not expect the fraction of files of different
sizes to
change as a file system ages. Thus, if they find it useful to assign
different parts of the disk to files of different sizes, they can
anticipate
the allocation of sizes to disk areas to not need radical change as
time
passes.
Many peer-to-peer systems use free space on computers to store
shared data, so
the amount of used space is of great importance. With an understanding
of how
this free space decreases as a file system ages, a peer-to-peer system
can
proactively plan how much it will need to offload shared data from each
file
system to make room for additional local content. Also, since a common
reason
for upgrading a computer is because its disk space becomes exhausted, a
peer-to-peer system can use a prediction of when a file system will
become
full as a coarse approximation to when that file system will become
unavailable.
6 Related Work
This research extends our earlier work in measuring and modeling
file-system
metadata on Windows workstations. In 1998, we collected snapshots of
over ten
thousand file systems on the desktop computers at Microsoft [9].
The focus of the earlier study was on variations among
file systems within the sample, all of which were captured at the same
time.
By contrast, the focus of the present study is on longitudinal
analysis,
meaning how file systems have changed over time.
Prior to our previous study, there were no studies of static
file-system
metadata on Windows systems, but there were several such studies in
other
operating-system environments. These include Satyanarayanan's study of
a
Digital PDP-10 at CMU in 1981 [24],
Mullender and Tanenbaum's study
of a Unix system at Vrije Universiteit in 1984 [20], Irlam's
study of 1050 Unix file systems in 1993 [14], and Sienknecht et
al.'s study of 267 file systems in 46 HP-UX systems at Hewlett-Packard
in
1994 [25]. All of these
studies involved snapshots taken at a
single time, like our study in 1998. There have also been longitudinal
studies of file-system metadata, but for significantly shorter times
than
ours: Bennett et al. studied three file servers at the
University of Western
Ontario over a period of one day in 1991 [4], and Smith and
Seltzer studied 48 file systems on four file servers at Harvard over a
period
of ten months in 1994 [26].
We are aware of only one additional collection of static file-system
metadata
since our previous study. In 2001, Evans and Kuenning captured
snapshots from
22 machines running various operating systems at Harvey Mudd College
and
Marine Biological Laboratories [11].
Their data collection and
analysis focused mainly, but not exclusively, on media files. Their
findings
show that different types of files exhibit significantly different size
distributions, which our results support.
Many studies have examined dynamic file-system traces rather than
static file
system snapshots. These studies are complementary to ours, describing
things
we cannot analyze such as the rate at which bytes are read and written
in a
file system. A few examples of such studies are Ousterhout et al. 's
analysis
of the BSD file system [21],
Gribble et al. 's analysis of
self-similarity in the dynamic behavior of various file
systems [12], Vogels's
analysis of Windows NT [28],
and
Roselli et al. 's analysis of HP-UX and Windows NT [23].
In addition to file-system measurement research, there has been much
work in
modeling file-system characteristics, most notably related to the
distribution
of file sizes. Examples of work in this area include that of
Satyanarayanan [24], Barford
and Crovella [3],
Downey [10], and
Mitzenmacher [19].
In 2001, Evans and Kuenning broke down measured file-size
distributions
according to file type, and they modeled the sizes using log-lambda
distributions [11]. They found
that video and audio files can
significantly perturb the file-size distribution and prevent simple
size
models from applying. We did not find this to be true for file sizes in
our
sample population. However, we did find video, database, and blob files
responsible for a second peak in the distribution of bytes by
containing file
size.
In our previous study, we modeled directory depth with a Poisson
distribution [9], but we have
herein proposed a generative model in
which the attractiveness of an extant directory as a
location for a new
subdirectory is proportional to , where is the count of
directory 's extant subdirectories. This is strikingly
similar to the rule
for generating plane-oriented recursive trees, wherein the probability
is
proportional to  [15]. [15].
7 Summary and Conclusions
Over a span of five years, we collected metadata snapshots from more
than
63,000 distinct Windows file systems in a commercial environment,
through
voluntary participation of the systems' users. These systems contain 4
billion files totaling 700 TB of file data. For more than 10% of
these file
systems, we obtained snapshots in multiple years, enabling us to
directly
observe how these file systems have changed over time. Our measurements
reveal several interesting properties of file systems and offer useful
lessons.
One interesting discovery is the emergence of a second mode in the
GB
range in the distribution of bytes by containing file size. It makes us
wonder if at some future time a third mode will arise. The increasingly
large fraction of content in large files suggests that variable block
sizes, as supported by ZFS [6]
and NTFS [27],
are becoming increasingly important. Since a few large files, mainly
video, database, and blob files, are contributing to an increasing
fraction of file-system usage, these file extensions are ideal
candidates for larger block sizes.
Although large files account for a large fraction of space, most
files
are 4 KB or smaller. Thus, it is useful to colocate several small
files
in a single block, as ReiserFS [22]
does, and to colocate
small file content with file metadata, as NTFS does. Our finding that
most directories have few entries suggests yet another possibility:
Colocate small file content with the file's parent directory. An even
more extreme solution is suggested by the fact that in 2004, the
average
file system had only 52 MB in files 4 KB or smaller. Since
this number
is becoming small relative to main memory sizes, it may soon be
practical to avoid cache misses entirely for small files by prefetching
them all at boot time and pinning them in the cache.
Another noteworthy discovery is that the fraction of files locally
modified decreases with time, an effect significant enough to be
observable in only a five-year sample. It would appear that users'
ability to generate increasing amounts of content is outstripped by the
phenomenal growth in their disks. If individuals copying content from
each other becomes increasingly common, then applications like
peer-to-peer backup will have increasing amounts of inter-machine
content similarity to leverage to obviate copying.
We were surprised to find a strong negative correlation between
namespace depth and file size. Such a strong and temporally-invariant
correlation, in combination with the well-known correlation between
file
extension and file size, can help us make predictions of file size at
creation time. This may be useful, e.g., to decide how many blocks to
initially allocate to a file.
We also discovered that a simple generative model can account for
both
the distributions of directory depth and the count of subdirectories
per
directory. The model we developed posits that new subdirectories are
created inside an existing directory in offset proportion to the count
of subdirectories already in that directory. This behavior is easy to
simulate, and it produces directory-depth and directory-size
distributions that closely match our observations.
Finally, it is remarkable that file system fullness over the course
of
five years has changed little despite the vast increase in file system
capacity over that same period. It seems clear that users scale their
capacity needs to their available capacity. The lesson for storage
manufacturers is to keep focusing effort on increasing capacity,
because
customers will continue to place great value on capacity for the
foreseeable future.
The authors would like to express great thanks to the many Microsoft
users who
consented to us taking snapshots of their file systems. Without them,
this
study would have been impossible. We also thank Jim Gray, Catharine van
Ingen, and Tim Harris for their comments on early drafts of this paper.
Finally, we thank the anonymous reviewers and our shepherd, Randal
Burns, for
their many helpful comments and suggestions.
-
- 1
- ADYA, A., BOLOSKY, W., CASTRO,
M., CERMAK, G., CHAIKEN, R.,
DOUCEUR, J., HOWELL, J., LORCH, J.,
THEIMER, M., AND WATTENHOFER, R. P.
FARSITE: Federated, available, and reliable storage for an incompletely
trusted environment.
In Proceedings of the Fifth USENIX Symposium on Operating Systems
Design and Implementation (OSDI) (Boston, MA, December 2002),
pp. 1-14.
- 2
- ARPACI-DUSSEAU, A. C., AND
ARPACI-DUSSEAU, R. H.
Information and control in gray-box systems.
In Proceedings of the 18th ACM Symposium on Operating Systems
Principles (SOSP) (Banff, Canada, October 2001), pp. 43-56.
- 3
- BARFORD, P., AND CROVELLA,
M.
Generating representative web workloads for network and server
performance evaluation.
In Proceedings of the 1998 Joint International Conference on
Measurement and Modeling of Computer Systems (SIGMETRICS)
(Madison, WI, June 1998), pp. 151-160.
- 4
- BENNETT, J. M., BAUER, M. A.,
AND KINCHLEA, D.
Characteristics of files in NFS environments.
In Proceedings of the 1991 ACM SIGSMALL/PC Symposium on Small
Systems (Toronto, Ontario, June 1991), pp. 33-40.
- 5
- BOLOSKY, W. J., CORBIN, S., GOEBEL,
D., AND DOUCEUR, J. R.
Single instance storage in Windows 2000.
In Proceedings of the 4th USENIX Windows Systems Symposium
(Seattle, WA, August 2000).
- 6
- BONWICK, J.
Zfs: The last word in file systems.
Available at https://www.opensolaris.org/os/
community/zfs/docs/zfs_last.pdf.
- 7
- CHAPMAN, G.
Why does Explorer think I only want to see my documents?
Available at https://pubs.logicalexpressions.com/
Pub0009/LPMArticle.asp?ID=189.
- 8
- COX, L. P., MURRAY, C. D.,
AND NOBLE, B. D.
Pastiche: Making backup cheap and easy.
In Proceedings of the Fifth USENIX Symposium on Operating Systems
Design and Implementation (OSDI) (Boston, MA, December 2002),
pp. 285-298.
- 9
- DOUCEUR, J. R., AND BOLOSKY,
W. J.
A large-scale study of file-system contents.
In Proceedings of the 1999 Joint International Conference on
Measurement and Modeling of Computer Systems (SIGMETRICS)
(Atlanta, GA, May 1999), pp. 59-70.
- 10
- DOWNEY, A. B.
The structural cause of file size distributions.
In Proceedings of the 2001 Joint International Conference on
Measurement and Modeling of Computer Systems (SIGMETRICS)
(Cambridge, MA, June 2001), pp. 328-329.
- 11
- EVANS, K. M., AND KUENNING,
G. H.
A study of irregularities in file-size distributions.
In Proceedings of the 2002 International Symposium on Performance
Evaluation of Computer and Telecommunication Systems (SPECTS) (San
Diego, CA, July 2002).
- 12
- GRIBBLE, S. D., MANKU, G. S.,
ROSELLI, D. S., BREWER, E. A.,
GIBSON, T. J., AND MILLER,
E. L.
Self-similarity in file systems.
In Proceedings of the 1998 Joint International Conference on
Measurement and Modeling of Computer Systems (SIGMETRICS)
(Madison, WI, June 1998), pp. 141-150.
- 13
- GUNAWI, H. S., AGRAWAL, N., ARPACI-DUSSEAU,
A. C., ARPACI-DUSSEAU, R. H.,
AND SCHINDLER, J.
Deconstructing commodity storage clusters.
In Proceedings of the 32nd International Symposium on Computer
Architecture (ISCA) (Madison, WI, June 2005), pp. 60-71.
- 14
- IRLAM, G.
Unix file size survey - 1993.
Available at https://www.base.com/gordoni/ufs93.html.
- 15
- MAHMOUD, H. M.
Distances in random plane-oriented recursive trees.
Journal of Computational and Applied Mathematics 41
(1992), 237-245.
- 16
- MESNIER, M., THERESKA, E., GANGER,
G. R., ELLARD, D., AND SELTZER,
M.
File classification in self-* storage systems.
In Proceedings of the 1st International Conference on Autonomic
Computing (ICAC) (New York, NY, May 2004).
- 17
- MICROSOFT.
SetFileTime.
Available at MSDN, https://msdn.microsoft.com/library/
default.asp?url=/library/en-us/wcecoreos5/html/
wce50lrfsetfiletime.asp.
- 18
- MITCHELL, S.
Inside the Windows 95 file system.
O'Reilly and Associates, 1997.
- 19
- MITZENMACHER, M.
Dynamic models for file sizes and double Pareto distributions.
Internet Mathematics 1, 3 (2004), 305-333.
- 20
- MULLENDER, S. J., AND TANENBAUM,
A. S.
Immediate files.
Software--Practice and Experience 14, 4 (April 1984),
365-368.
- 21
- OUSTERHOUT, J. K., COSTA, H. D.,
HARRISON, D., KUNZE, J. A., KUPFER,
M., AND THOMPSON, J. G.
A trace-driven analysis of the UNIX 4.2 BSD file system.
In Proceedings of the 10th ACM Symposium on Operating Systems
Principles (SOSP) (Orcas Island, WA, December 1985),
pp. 15-24.
- 22
- REISER, H.
Three reasons why ReiserFS is great for you.
Available at https://www.namesys.com/.
- 23
- ROSELLI, D., LORCH, J. R., AND
ANDERSON, T. E.
A comparison of file system workloads.
In Proceedings of the 2000 USENIX Annual Technical Conference
(San Diego, CA, June 2000), pp. 41-54.
- 24
- SATYANARAYANAN, M.
A study of file sizes and functional lifetimes.
In Proceedings of the 8th ACM Symposium on Operating Systems
Principles (SOSP) (Pacific Grove, CA, December 1981),
pp. 96-108.
- 25
- SIENKNECHT, T. F., FRIEDRICH, R. J.,
MARTINKA, J. J., AND FRIEDENBACH,
P. M.
The implications of distributed data in a commercial environment on the
design of hierarchical storage management.
Performance Evaluation 20, 1-3 (May 1994), 3-25.
- 26
- SMITH, K., AND SELTZER, M.
File layout and file system performance.
Technical Report TR-35-94, Harvard University, 1994.
- 27
- SOLOMON, D. A.
Inside Windows NT, 2nd ed.
Microsoft Press, 1998.
- 28
- VOGELS, W.
File system usage in Windows NT 4.0.
In Proceedings of the 17th ACM Symposium on Operating Systems
Principles (SOSP) (Kiawah Island, SC, December 1999),
pp. 93-109.
A Five-Year Study
of File-System Metadata
This document was generated using the
LaTeX2HTML
translator Version 2002-2-1 (1.70)
Copyright © 1993, 1994, 1995, 1996,
Nikos Drakos,
Computer Based Learning Unit, University of Leeds.
Copyright © 1997, 1998, 1999,
Ross Moore,
Mathematics Department, Macquarie University, Sydney.
The command line arguments were:
latex2html -split 0 -show_section_numbers
-local_icons fsstudy.tex
The translation was initiated by Nitin Agrawal on 2006-12-18
Nitin Agrawal
2006-12-18
|