| ||||||||||||||||||||||||||||||||||||||||||||||||||||
USENIX Technical Program - Paper - Proceedings of the Third Symposium on Operating Systems Design and Implementation
[Technical Program]
Fine-Grained Dynamic Instrumentation of | |||||||||||||||||||||||||||||||||||||||||||||||||||||||||||||||||||||||||||||||||||||||||||||||||||||||||||||||||
| Ariel Tamches and Barton P.
Miller
Computer Sciences Department University of Wisconsin Madison, WI 53706-1685 |
| {tamches,bart}@cs.wisc.edu |
Dynamic instrumentation supports monitoring functionality, such as debugging and profiling, alongside mechanisms for extensibility and adaptability, in a single infrastructure. Kernels become evolving entities, able to measure and adapt themselves to accommodate real-world runtime usage patterns.
The main contribution of our work is the design and implementation of a fine-grained splicing mechanism for a stock commodity kernel. The contents of the inserted code--whether performance profiling annotations, optimized versions of functions, or process-specific kernel extensions--are orthogonal to the issue of how to splice it into a commodity kernel.
We have implemented KernInst, an instrumentation tool for the Solaris kernel . Its main features are:
Fully dynamic. KernInst is loaded and instruments a running kernel, without any need to recompile, reboot, or even pause the kernel.
Fine-grained. Instrumentation points (locations where code can be spliced) can be almost any machine code instruction in the kernel. This contrasts with kernels that allow coarser-grained code changes, such as at function granularity (e.g., VINO [17] and Synthetix [16]), or only allow entire kernel modules to be changed (which many commodity kernels allow).
Runs on a commodity kernel. This allows us to immediately run real-world programs.
Runs on an unmodified kernel. Any UltraSPARC system running Solaris can immediately use KernInst.
Performance profilers can use dynamic instrumentation to insert performance-gathering code annotations, such as incrementing a counter at the start of a function or basic block. Annotation code also can start and stop timers or access hardware performance counters. More complex code sequences and control structures can be used to predicate measurements on kernel state, such as the currently running process. More detail on using dynamic kernel instrumentation for performance profiling is presented in Section 4.
Dynamic instrumentation can also be used for kernel tracing, by splicing logging code at the desired kernel code locations during runtime. When the desired trace is collected, kernel code can be restored to its original contents, so overhead is incurred only when tracing is desired. This contrasts with a static kernel instrumentation system (such as a binary rewriter), which would insert code lasting for the entire run of the kernel.
Code coverage can be measured by splicing code that sets a flag (one per basic block) indicating that code has been reached. Instrumentation for a basic block can be removed as soon as the flag is set; thus, the overhead of code coverage actually decreases over time. Basic block coverage demonstrates the need for instrumentation to be fine-grained.
Kernel debuggers can be implemented using fine-grained dynamic instrumentation. Breakpoints can be inserted at any machine code instruction by splicing code that displays kernel state and (optionally) pauses the executing thread and informs the debugger. Conditional breakpoints are easily accommodated by predicating the breakpoint with the appropriate condition.
Security auditing annotations can be installed using dynamic instrumentation. Solaris can audit thread creation and deletion, file system pathname lookups, file system vnode creation, successful and unsuccessful credential checks for super-user access, process forks, core dumps, stream device operations, file opens, closes, and chdirs, and many more. However, auditing code is turned off by default; turning it on requires a kernel recompile and reboot. With dynamic instrumentation, the auditing package can be distributed as an independent kernel add-on, and installed onto a running system. This requires a fine-grained splicing mechanism, since auditing checks often take place in the middle of kernel functions.
Dynamic instrumentation enables automated runtime code optimization, based on performance feedback gathered by dynamic profiling annotations. One example is function specialization [16] on an input parameter. A function can be dynamically instrumented to collect a histogram of the desired parameter, which is later examined for a frequent value. Annotation code is then removed, and a specialized version of the function's machine code is generated, with constant propagation applied to the specialized parameter. The function then has the following code spliced at its entry: "if the input parameter equals the common value, then jump to the optimized version; else, fall through to the original version". A further optimization can sometimes bypass this check: sites where the function is called can be examined for an actual parameter that always equals the specialized value. If so, the call site is altered to directly call the optimized version of the function.
Moving seldom-executed basic blocks out of line to improve instruction-cache behavior [13] can be performed using fine-grained dynamic instrumentation. A function's entry and exit point(s) can be annotated to measure the number of icache misses it incurs. If the value is high, the function's basic blocks can be instrumented to count execution frequency. An optimized version of the function, with infrequently executed blocks moved out of line, is then installed by splicing in code at the entry of the original function to unconditionally jump to the optimized version. As with parameter specialization, the extra jump overhead can often be eliminated by altering sites where the function is called.
Dynamic kernel instrumentation also may be used to change kernel functionality, such as installing a process-specific version of a kernel policy. Extensible operating systems that download process-specific code into the kernel for improved performance [3, 6, 14, 17] perform this kind of adaptation. Dynamic instrumentation can easily provide a similar operation in a commodity kernel by splicing the following code at a desired kernel function: "if currently executing process id equals customized pid then jump to customized version in the patch area; else, fall through".
Applications using dynamic kernel instrumentation have varying requirements for kernel source code. KernInst provides the kernel's runtime symbol table (function names and their starting locations in memory) and a control flow graph of basic blocks at the machine code level. With this information, applications can readily identify the machine code locations of function entries, exits, and function calls. A benefit of working with machine code is that the effect of compiler optimizations, which can reorder and remove code, are visible. Certain applications require more information about the kernel. A kernel developer using dynamic kernel instrumentation to trace a specific source code line needs the compiler's debugging line number information to map line numbers into kernel addresses. (Fortunately, kernel developers are likely to have access to this information.) Other applications may require knowing only the names of specific kernel functions. An application wanting to profile file system pathname-to-vnode translation in Solaris needs to know that the relevant function is lookuppn. (End users of such an application do not need to know this.) Other applications will work solely with the information KernInst provides; for example, an optimizer that moves seldom-executed basic blocks out of line at run-time works at the machine code level.
An important feature of our dynamic instrumentation is that splicing is independent of code generation. KernInst can splice machine code that has been created from code generation packages such as VCODE [7], an interpreter performing just-in-time compilation, or from precompiled position-independent code.
The structure of the KernInst system is shown in Figure 1. Applications that wish to instrument the kernel interact with kerninstd, a user-level daemon. There is also a small runtime-loaded KernInst driver /dev/kerninst, a run-time allocated patch area heap, and a runtime-allocated heap of timers and counters (used when the instrumentation code contains performance-gathering annotations). Kerninstd maps both heaps into its address space using mmap on /dev/kmem. To minimize our tool's presence in the kernel, most functionality is in kerninstd. When it needs to perform actions in the kernel's address space, kerninstd enlists the assistance of /dev/kerninst.

|
This section discusses how KernInst performs fine-grained dynamic instrumentation of a commodity operating system kernel. We present specific examples from our current Solaris implementation; however, we believe that dynamic kernel instrumentation is possible on most modern operating systems.
Code patches, which hold the dynamically generated code being inserted, are allocated from the patch area heap in the kernel's address space. Kerninstd cannot allocate kernel memory, so it has /dev/kerninst perform the necessary kmem_alloc via an ioctl.
To instrument, kerninstd needs to know where functions reside in memory. Thus, it needs access to the kernel's runtime symbol table. The symbol table on disk (/kernel/unix) is insufficient because it is incomplete; most of the kernel is contained in runtime-loaded modules. /dev/kerninst reads the kernel's runtime symbol table directly from kernel memory on behalf of kerninstd. Solaris provides a similar interface through a driver /dev/ksyms, but it does not label all functions with their associated kernel module.
Both emitting code into the patch area and splicing require write permission to the kernel's address space. Kerninstd writes to the patch area heap directly since it is mapped into its address space (mmap of /dev/kmem). Splicing into existing kernel code is more difficult, because Solaris (like most operating systems) does not allow certain parts of the kernel code to be modified, even from within the kernel. Specifically, the first three Solaris kernel modules, collectively termed the kernel nucleus2, cannot be written on UltraSPARC platforms because they are mapped only into the I-TLB, and with read-only permission. To write to code in the nucleus, /dev/kerninst maps the appropriate page (using segkmem_mapin), performs the write, and then unmaps it (using segkmem_mapout).
Kerninstd builds a control flow graph of the kernel's machine code by partitioning its functions into basic blocks. This graph is needed for performing live register analysis during dynamic code generation and during splicing. No source code or debugging information is used in this process. First, the runtime symbol table is parsed to determine the in-memory start of all kernel functions. Each function's machine code is then read from memory and parsed into basic blocks. A basic block ends when an instruction that potentially interrupts the program's control flow (except function call) is encountered. Jump tables and jumps to constant addresses are determined from a backwards slice on the register(s) used in the jump. Other register-relative jumps are marked as unanalyzable. KernInst's control-flow graph construction is similar to that done by binary rewriters for user programs, such as EEL [12] and ATOM [20]. However, since KernInst performs its processing at runtime, all code is available, including runtime-loaded modules. Furthermore, since our control-flow graph is interprocedural, more aggressive data-flow analyses are possible.
Next, kerninstd performs an interprocedural live register analysis of the kernel code. For each basic block, the set of live registers at its entry is calculated and stored for later use in code generation and splicing. To conserve storage, kerninstd does not store the live registers for every kernel machine code instruction; such fine-grained analysis is performed during instrumentation as needed.
Figure 2 summarizes the code components of Solaris 2.5.1 running on an UltraSparc. KernInst performs its one-time structural analysis efficiently, as shown in Figure 3. Structural analysis could be optimized by making the results persistent; they only need to be recalculated when a kernel module is loaded or unloaded. However, since the start-up processing time is only about 15 seconds, we have not pursued this optimization.
| Kernel Component | Number |
|---|---|
| Modules | 77 |
| Functions | 8,457 |
| Basic blocks | 107,976 |
| Instruction bytes | 2.59 MB |
Unlike a compiler, KernInst is concerned with inserting (splicing) generated code in the midst of existing kernel code. For safety, dynamically generated code must only write to registers that are free (i.e., do not contain live information) at the instrumentation point. If more registers are required than are free, kerninstd brackets the code with stack frame set-up and tear-down to free up additional registers. On the SPARC, this involves emitting save and restore instructions. Because these instructions cannot safely be executed within the trap handlers for register window overflow and underflow, kerninstd cannot instrument these routines3 .
Figure 4 lists kerninstd's dynamic instrumentation steps. This section describes the first three: live register analysis, allocating a patch to hold the generated code, and code generation.
| Instrumentation Step | Cost | When | Described | ||
|---|---|---|---|---|---|
|
1. Finding free registers before and after instrumentation point |
The first time code is spliced at this instrumentation point; results are cached thereafter | Section 3.3 | |||
| Retrieve live registers at the bottom of the basic block (calculated at startup) | 66µs | ||||
| Calculate live registers before and after the instrumentation point machine code instruction. Cost is 19µs per machine code instruction following the instrumentation point in the basic block. (Cost assumes 5 instructions.) | 95µs | ||||
| Return result | 60µs | ||||
| 2. Calculate size of patch & allocate | 30µs | Each instrumentation request | |||
| 3. Generate and emit code into patch (add 1 to counter in this example) | 79µs | ||||
| 4. Emit relocated instruction and (if necessary) jump to instruction following the instrumentation point | 27µs | Section 3.4.1 | |||
|
5. Creating & installing splice to patch (assuming a springboard is required). Unlike the patch area, springboards are not mapped into kerninstd for quick writing. |
|||||
| Allocate springboard | 13µs | Section 3.4.3 | |||
| Generate springboard code | 26µs | ||||
| Write springboard contents to kernel (if springboard is nucleus) | 135µs | ||||
| Write springboard contents to kernel (if springboard is not nucleus) | 40µs | ||||
| Overwrite 1 instruction at the instrumentation point (if in nucleus) | 74µs | Section 3.4.2 | |||
| Overwrite 1 instruction at the instrumentation point (if not in nucleus) | 35µs | ||||
| Total (worst case: both instrumentation point and springboard in nucleus) | 600µs | ||||
| Total (both instrumentation point and springboard not in nucleus) | 471µs | ||||
| Total (best case: no springboard needed, instrumentation point not in nucleus) | 392µs | ||||
The first step, live register analysis, determines registers that are available for scratch use at the instrumentation point. Finding live registers is a classic backwards data-flow problem operating on a control-flow graph. Since the set of live registers at the top of each basic block was calculated and stored during kerninstd's structural analysis start-up phase, finding live registers at a given instruction within the basic block can be done quickly. The free registers at that point are those that are not live. Live register analysis averages 221µs in our current implementation.
The second step in code generation allocates patch space that will hold the dynamically generated code. The patch size is the sum of: the size of the machine code being inserted, extra instructions to spill some registers to the stack (if more scratch registers are needed than are available), space for the original instruction at the instrumentation point, and space for a jump back to the instruction following the instrumentation point. If several pieces of instrumentation are inserted at the same instrumentation point, kerninstd simply compounds them in the same code patch. As a rule, there is one code patch for each spliced instrumentation point.
There are usually several possible code sequences (with varying number of instructions) for the returning jump, depending on the required displacement. Thus, the number of instruction bytes required for the code patch cannot be determined until it has been allocated. The circular dependency is broken by assuming the maximum number of instructions needed to perform a jump (4 instructions on SPARC, assuming 32-bit addresses). Space for the code patch is then allocated from the patch heap. Calculating the patch size and allocating it typically takes 30µs.
Once patch space is allocated, dynamically generated code is emitted. This step could not take place before patch allocation because the machine code representation of PC-relative instructions (such as SPARC's call instruction) depend on their instruction addresses. Because the entire patch area heap was mapped into kerninstd space for writing, generated code is written directly into the patch. For a simple annotation--incrementing a 64-bit integer counter--code generation takes 79µs. Most of this cost is due to the kernel's policy of deferring page mapping until the first time it is written. Thus, although no explicit kernel calls were made to write to the mapped kernel memory, the kernel was performing noticeable work during the write. Subsequent "warm" writes do not require mapping, and complete in just µs. However, since patches are typically written only once, times will normally fall under the slower "cold" value.
Kerninstd splices by overwriting the instrumentation point instruction with a branch to patch code. The code patch contains the dynamically generated code, the original overwritten instruction, and a jump back to the instruction stream after the instrumentation point. Figure 5 illustrates this basic design.
Ideally, a runtime code splicer should: be fine-grained, able to splice code at any machine code instruction; splice quickly, without the need to pause or synchronize with executing threads; splice without the need for customized code at the instrumentation point (i.e., unmodified kernels); work on multi-threaded kernels; and allow splicing to safely occur at any time, even with threads potentially executing at or near the instrumentation point during splicing. Kerninstd fulfills all of these goals.
Splicing a multi-threaded kernel without pausing requires replacing only one machine code instruction at the instrumentation point (with a branch to the code patch). Section 3.4.2 discusses the safety motivation behind single-instruction splicing. Displacement is an issue with single-instruction splicing; branch instructions often have insufficient range to reach a code patch from an instrumentation point. Section 3.4.3 discusses springboards, our solution to this problem. But first, we discuss the contents of a code patch.
Patch code ends with a jump back to the instruction following the instrumentation point. If the instrumentation point instruction is an unconditional branch or jump, this step is skipped. If a single branch instruction does not have sufficient range, a scratch register is written with the destination address and then used for the jump. Since this jump executes after the relocated instruction, an available scratch register must be found from the set of registers free after the instrumentation point. This contrasts with instrumentation code, which executes in a context of free registers before the instrumentation point. If no integer registers are available, Kerninstd makes one available by spilling it to the stack4. Kerninstd generates the relocated instrumentation point instruction and the returning jump in 36µs.
Splicing at control transfer instructions having a delay slot requires an extra step. Both the control transfer instruction and its successor (the delay slot instruction) are copied to the code patch. This ensures that the delay slot instruction is executed with the proper semantics (i.e., before the control transfer instruction has changed the PC). An example is shown in Figure 6. Note that when the code patch completes, it returns to the instruction after the delay slot, to ensure that it is not executed twice. As before, if the control transfer instruction was unconditional, there is no need to emit a jump back to the instruction stream, because it would never be executed.
Splicing at the delay slot of a control transfer instruction is difficult because the branch to the code patch will occur before the control transfer instruction has changed the PC. When the code patch completes, it cannot jump to the instruction following the delay slot; the effects of the control transfer instruction still need to be executed. Unfortunately, there can be two valid return locations if the control transfer instruction is a conditional branch (taken and fall-through). The solution is to effectively relocate the control transfer instruction to the end of the code patch. If this instruction falls through, the code patch returns to the instruction following the delay slot (as usual). This approach works if the instrumentation point instruction is always executed as the delay slot of the preceding control transfer instruction. However, on rare occasions (nine in the Solaris kernel), a delay slot instruction is the target of a branch, and thus is not always executed as the delay slot of the preceding control transfer instruction. Kerninstd does not instrument these cases since a code patch would have to choose from two different instruction sequences for returning. This case is detected by noticing a delay slot instruction at the start of a basic block.
Fine-grained splicing by replacing more than a single instruction is inherently unsafe on an unmodified commodity kernel, because a thread can execute a mix of the pre-slice and post-splice sequences. Figure 7a shows the first three instructions of the kernel routine kmem_alloc. The PC of a kernel thread is located before the third instruction, when a two-instruction splice replaces its second and third instructions. (The instrumentation point is the second instruction of kmem_alloc; since two instructions are used in the splice, the third instruction of the function is also replaced.) Since the thread has already executed the sub instruction but not its successor (sra) when the splice occurs, an unsafe sequence of instructions will be executed, as shown in Figure 7b. Note that this problem occurs even in an architecture that can write the two instructions atomically.
In theory, this hazard could be avoided by pausing and performing a backtrace on all kernel threads to check whether execution is currently within, or will return to, one of the instructions being replaced. If a hazard is detected, then splicing is deferred. This strategy is currently used by the Paradyn instrumentation system for user programs [9, 10]. However, it does not work in a kernel, for several reasons. First, pausing the kernel it is not allowed; even if it were, this would involve freezing all of the kernel threads (except, presumably, for the kerninstd thread, which is performing the splice), possibly disrupting critical background activities. Second, performing the necessary backtrace on all threads (of which there are thousands in the Solaris kernel) would be expensive. Third, even if pausing were possible and practical, a jump with an unanalyzable destination (such as a longjmp) may jump to the middle of a splice sequence, resulting in the execution of an inconsistent code sequence. A fourth problem with multiple-instruction splicing occurs when the instrumentation point is at the end of a basic block B1. Some of the splice sequence spills over into the next basic block B2. If B2 is reachable from another block (say, by a branch from block B3), then code taking the path (B3, B2) will execute the second half of a splice sequence, an inconsistent code sequence which can crash the kernel. For these reasons, we conclude that fine-grained dynamic instrumentation is unsafe when using multiple-instruction splicing.
Single-instruction splicing is difficult on architectures whose branch instructions always have a delay slot, such as MIPS. This forces us to use a delayed branch instruction for splicing, resulting in an unusual execution sequence when jumping to patch code. The instruction following the instrumentation point implicitly becomes the delay slot of the splice branch instruction, and thus is executed before the code patch is reached. In particular, the instruction after the instrumentation point is executed before the instruction originally at the instrumentation point, which gets relocated to the code patch. Thus, the execution ordering of the instruction originally at the instrumentation point and its successor are reversed. In some cases, this can be worked around. If the instrumentation point instruction and its successor are mutually independent, then reversing their execution order is safe. If not, but the instrumentation point instruction is independent of its successor, and if the successor instruction is idempotent, then both the instrumentation point instruction and its successor can be placed in the code patch. The resulting execution sequence is (1) successor, (2) original instrumentation point instruction, (3) successor. Under the mentioned constraints, step (1) is equivalent to a nop. Of course, the independence and idempotency constraints will not always be met, making single-instruction splicing on always-delayed-branch architectures difficult. A final possibility is to splice by replacing the instrumentation point instruction with a trap or illegal instruction. This will immediately jump to a trap handler, which, if it can be safely instrumented, can check the offending instruction's PC and perform a long jump to the appropriate code patch. Note that the current implementation of kerninstd is on the SPARC v9 architecture, which has a non-delayed branch instruction (ba,a) that we always use for splicing, thus avoiding these difficulties.
Single-instruction splicing on variable-instruction-length architectures such as x86 is challenging; depending on the existing code at the instrumentation point, a jump instruction used in splicing (5 bytes on x86) may not overwrite exactly one instruction. If the jump instruction is smaller than the instruction being overwritten, then the new instruction stream will contain the newly written jump instruction, followed by the tail end of the original instruction (which will never be executed). On the other hand, when the instrumentation point contains an instruction that is smaller than the jump instruction, splicing overwrites more than one instruction. This can cause problems because the next instruction will also be overwritten; if that instruction is the destination of a branch, a corrupted instruction stream can be executed. This case can be handled by splicing using a one-byte trap or other illegal instruction. This will transfer control to a trap handler, which, if it can be instrumented using the more conventional jump instruction, can be made to look up the address of the offending instruction in a hash table, undo any processor-state side effects of the trap, and transfer control to the appropriate code patch. Since there are single-byte trap instructions, it is always possible to overwrite just one instruction, and is thus hazard-free.
Our current implementation of KernInst on the UltraSPARC splices instrumentation points outside the kernel nucleus in 35µs, via a pwrite to /dev/kmem. If the instrumentation point is within the nucleus, kerninstd has /dev/kerninst perform the necessary map, write, and unmap sequence (see Section 3.1), which completes in 74µs.
KernInst implements a general solution to the displacement problem called springboards. A springboard is a scratch area that is reachable from the instrumentation point by a suitable jump instruction. The idea is for the splice instruction to merely branch to an available nearby springboard, which in turn takes as many instructions as needed to jump to the code patch. Figure 9 shows an example of code splicing in the presence of springboards. Like the code patch, the springboard is written before the branch instruction is written at the instrumentation point, so no kernel thread will execute springboard code until the splice has completed. Thus, the safety properties of single-instruction splicing are maintained.
The springboard approach requires chunks of scratch space (collectively, the springboard heap) to be conveniently located at various spots in the kernel, so that every kernel instruction can reach the nearest chunk when using one of the suitable jumps of Figure 8. Fortunately, UNIX SVR4.2-based kernels (including Solaris), Linux, and Windows NT all have ideally suited available scratch space: the initialization and termination routines for dynamically loaded kernel modules.
In a kernel that allows modules to be loaded at runtime (and unloaded, when memory is tight), each module has initialization and termination routines that are called just after the module is loaded, and just before it is unloaded, respectively5. Kerninstd locks kernel modules in memory, which guarantees that the initialization and termination routines will no longer be called; this makes them free to use as springboard space. In addition, preventing module unloading and reloading obviates the need to re-insert splicing code changes that would be lost when and if a module gets re-loaded. In practice, no single kernel module approaches one megabyte in size, so even a jump instruction with a modest range, such as SPARC's ba,a, can easily reach the nearest springboard.
In Solaris, the first three kernel modules (the nucleus) are not subject to runtime loading or unloading, and thus do not have initialization and termination routines. Furthermore, in practice, the nucleus modules are loaded into kernel virtual memory far from the dynamically loaded ones, and thus cannot reach the latter's initialization and termination routines as potential springboard space. However, two routines within the nucleus, _start and main, are invoked only while the kernel is booting. Since they are never again executed, kerninstd adds these routines to the springboard heap. Figure 10 summarizes the springboard space set aside by our current Solaris 2.5.1/UltraSPARC implementation of kerninstd.
| Location | Size (bytes) |
|---|---|
| Nucleus (_start and main) | 884 |
| Outside nucleus (initialization & termination routines of kernel modules) | 7128 |
While the springboard technique may seem ad-hoc, it is applicable to most kernels with which we have experience. Furthermore, with 64-bit operating systems running on an architecture with 32-bit instructions, there is no possibility of finding a single branch instruction with 64 bits of displacement. Because they are not limited to a single instruction, springboard code can have arbitrary displacement, making them a general solution to the problem of reaching patches.
If a springboard is needed, kerninstd allocates it and generates its contents in 39µs. Its contents are then copied to kernel space. If the springboard does not reside within the kernel nucleus, kerninstd fills it with a single pwrite to /dev/kmem in 40µs. If the springboard is within the nucleus, kerninstd invokes /dev/kerninst to perform the write (see Section 3.1) in 135µs.
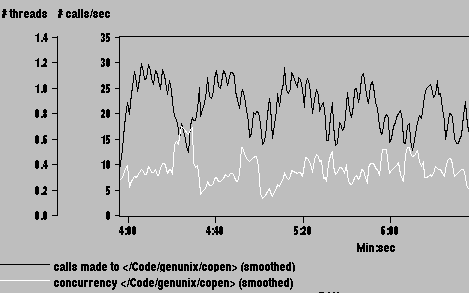
Performance metrics are formed by applying the primitives. Four metrics in our tool-kit library are call counts, average number of executing threads, average number of waiting threads, and virtual timers. Call counts simply record the number of times a function is called. The "calls made to" curve in Figure 11 shows an example of the number of calls to the kernel function copen. Average number of executing threads uses a counter to record the number of threads in a section of code (incremented at entry to the block and decremented at exit) and a value recording the last time the value being averaged has changed; the AOT is calculated using these values. The "concurrency" curve in Figure 11 shows an example of the average number of threads in function copen. Average waiting threads counts the number of threads waiting on a kernel mutex variable (kmutex_t), by instrumenting mutex_enter; the AOT primitive is applied to this counter. The underlying processor cycle counters used by KernInst measure elapsed (wall) time. Virtual (processor) time can be important in trying to isolate bottlenecks. KernInst measures virtual time by instrumenting the context switch handler; we can detect when a kernel thread is dispatched, and stop and re-start the timer primitive at the appropriate times.
Metrics can be constrained to a given process or kernel thread by predicating the primitives. To find the average number of kernel threads belonging to process P executing within function F over time, the AOT primitives spliced into the entry and exit points of F are predicated with "if current pid equals P then...".
SPARC compilers make instrumenting before a function's return challenging. If a function B (called from A) ends by calling C, then B is (tail call) optimized to unwind its stack frame in the delay slot of the call to C; this makes C return directly to A. To instrument at the exit point of B, KernInst first splices in a code sequence that de-optimizes the tail call sequence. This was first done by Paradyn [10].
Previous studies of proxy servers have shown file opens to be a common bottleneck, so we first measured the kernel function copen, which handles both file open and file creation. As shown in Figure 11, it is called 20-25 times per second, and averages about 0.4 threads executing within this code at any given time. Since Squid is a single-threaded program, this means that on average, 40% of Squid's elapsed time was spent either opening existing files for reading, or creating new files for writing.
|
copen performs two major calls: falloc to allocate an entry in the process's file descriptor table, then vn_open for file system-specific opening. Because Squid maintains one disk file per cached HTTP object, we expected falloc to be a bottleneck because it performs a linear search to find an available table entry. However, we found falloc to consume negligible run time; most of copen's time was spent in vn_open.
vn_open has two paths, one for creating files (where it calls vn_create), and one for opening files. We found that the vn_create path, although called only 8 times per second, accounted for almost all of vn_open's bottleneck. Thus, file creation (which, in Squid's case, is a call to open() with the O_CREAT flag) is the bottleneck.
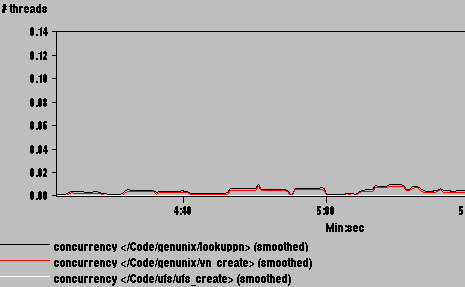
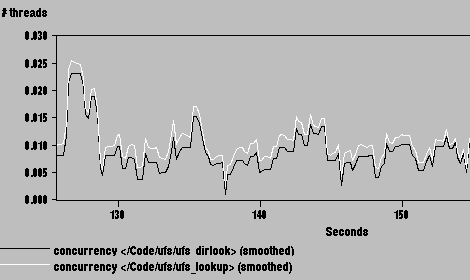
vn_create calls two important routines: lookuppn and ufs_create. lookuppn translates a full path name into a vnode structure. ufs_create creates a UFS file when given a vnode. Measurements for these routines are shown in Figure 12; it shows that both are bottlenecks.
|
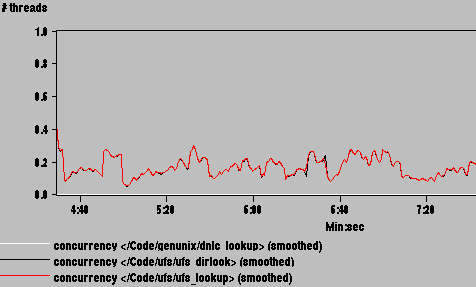
lookuppn, better known as namei, obtains a vnode by parsing path components one by one and calling the file system's lookup routine (ufs_lookup for UFS) for each. In the general case, ufs_lookup must go to disk to obtain an inode location from a directory file, and to read the inode contents. To optimize path name lookup, Solaris uses a directory name lookup cache, or DNLC, which hashes path name components to entries in an inode cache [5]. A DNLC hit bypasses both reading the directory file (ufs_dirlook) and reading the inode (ufs_iget). By dynamically instrumenting the kernel to count calls to ufs_dirlook and to lookuppn, we found that the DNLC hit rate was about 90%. Nevertheless, the miss penalty (execution of ufs_dirlook) was high enough to account for the ufs_lookup bottleneck, as shown in Figure 13.
|
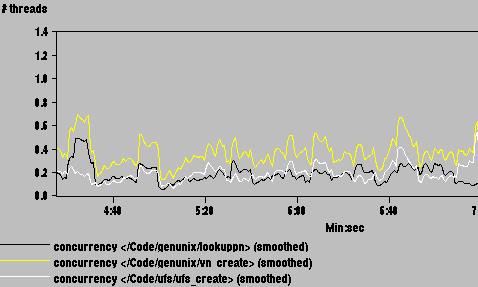
Squid's preponderance of small cache files (over 6,000 in our benchmark) overwhelmed the DNLC, which contains 2,181 entries by default. To address the bottleneck, we increased the DNLC size to the maximum allowed value of 17,498. As shown in Figure 14, this eliminates the ufs_lookup bottleneck; it now accounts for just 1% of Squid's elapsed time. Two permanent solutions suggest themselves. First, the DNLC should grow when needed, to avoid conflict misses. A flip side argument is that Squid simply uses too many small files, and should be redesigned to use one large fixed-size file for its disk cache.
|
Recall from Figure 12 that ufs_create was the second bottleneck in vn_create, accounting for 20% of Squid's elapsed time. Almost all of ufs_create's time is spent in ufs_itrunc, which is invoked because Squid passes the O_TRUNC flag to the open system call. Thus, about 20% of Squid's time is spent truncating existing cache files to zero size when opening them. Most of ufs_itrunc's time is spent in ufs_iupdat, which synchronizes updates to inodes. Thus, truncation is slow because UFS synchronizes changes to meta-data. Squid reuses obsolete disk cache files rather than deleting the obsolete file and creating the new one from scratch. The motivation is to avoid expensive meta-data operations required in file deletion (updating the parent directory file and freeing inodes). But the ufs_itrunc bottleneck shows that Squid's strategy is backfiring.
To address this bottleneck, we note that after deleting all of the file's inodes in truncation, some will be added (again, synchronously) as the new version of the file is written. If the new file size is at least equal to the old size, then the inode deletions and creations amount to a very expensive no-op. If the new file size is less than the original size, a (lesser) optimization is to only delete the inodes at the file's end that are no longer needed. We modified Squid to implement these changes; their effect is shown in Figure 15. The time spent synchronously updating inodes has been reduced from 20% of Squid's run time to about 6%.

|
The combined effect of the two optimizations are shown in Figure 16. The open system call, which once consumed 40% of Squid's run time, now takes only 1%. To this must be added the time spent truncating cache files (which is now done explicitly instead of through the O_TRUNC flag to open); from Figure 15, this is about 6%. Thus, what once took 40% of Squid's elapsed time now takes 7%.
Trusted code. In this approach, an authority certifies code as well-behaved. The certification may be that the generator of the code or the code itself lies in a specially protected directory that only a system administrator can update. Alternatively, the code may come from a trusted party on the network with a digital signature. This strategy is the fall-back position in our current work; kerninstd currently requires that applications written on top of it have super-user privileges.
Dynamically safe code. Two safety issues must be addressed when executing inserted code. First, safety violations must be detected, by inserting extra instructions into the dynamic code. Second, corrective action must be taken after a violation is detected. This action might be as simple as exiting from the dynamic code or killing the kernel thread that executed the offending code, or it might be much more complex. If the dynamic code is local, executing on behalf of a single user or process and not modifying any shared kernel data structures, then exiting the dynamic code is sufficient. Software fault isolation (SFI) techniques [21] augment the dynamic code with run-time checks to insure the code stays within a local space. VINO [17] and Exokernel [6] are two systems that use this technique. The dynamic code might be global, in common parts of the kernel and accessing data structures shared by other kernel threads. In this case, terminating the offending code may leave locks held or shared data structures in an inconsistent state. SFI techniques would need to be significantly extended to handle shared resources. Using a kernel whose data structures have transaction semantics (such as in VINO) might simplify constructing a recovery mechanism.
Statically safe code. Code that can be identified statically as safe has two advantages. First, the code is potentially more efficient since no run-time checks are needed. Second, since the code can never misbehave, no recovery scheme is needed. Proof carrying code (PCC) [14] is an example of this approach. However, PCC requires a safety policy to be formally defined for all resources accessed by the extension. Thus, inserted code can only access kernel data structures and call kernel functions that have gone through the rigor of a formally defined safety policy.
Combined approaches. A combination of static and dynamic checking, such as done with "safe" languages such as Java and Modula-3 in SPIN [3], potentially requires fewer run-time checks, but still needs a recovery strategy.
Extension code can be classified by its interaction with the underlying kernel. Annotations, such as performance measurement and debugging code, are orthogonal to the underlying computation. If an annotation only writes to its own data, does not transfer control outside of the annotations code, and is bounded in its time and resource requirements, a recovery strategy is easy: the annotation can be removed. Annotations that call other kernel functions (such as locking routines) may temporarily modify system state. Safety in such annotations requires a specification of the semantics of the kernel routines that the dynamic code calls [15]. We plan to design specifications that cover common synchronization scenarios. Recovery in a commodity operating system after an open annotation fault is an area we are actively researching.
Code adaptations intentionally change the behavior of the underlying system in some way. Examples include on-the-fly optimizations such as specialization [16] and outlining [13]. An adaptation may take some part of the kernel and replace it with code that accomplishes the same task, but in a more efficient or reliable manner. We are currently developing the mechanisms for closed-looped dynamic measurement and optimization. Adaptations may also include adding new functionality into the kernel. The safety and recovery issues for fine-grained adaptations are more complex than for open annotations.
Security issues are distinct from safety issues. Security is restricting information flows and authenticating data modifications. Annotations and adaptations may be efficient and safe without being secure. For example, sensitive kernel structures or process address spaces could be copied into a file quickly and safely, but open large security holes. Security can be addressed much like safety, by verifying that formally-defined policies for all resources accessed by inserted code are respected.
Digital's Continuous Profiling system (dcpi) [2] measures detailed performance metrics (such as cycles and icache misses) at the instruction level of a commodity kernel. Unlike KernInst, dcpi does not instrument kernel code in any way; this precludes metrics that cannot be readily sampled. KernInst could be used in concert with continuous profiling to create additional metrics in software.
Paradyn [10] dynamically instruments user programs. Our work differs from Paradyn in several ways: it applies to kernels; instrumentation is fine-grained, whereas Paradyn limits instrumentation points to function entries, exits, and calls sites; and KernInst instruments without pausing, whereas Paradyn incurs substantial overhead by pausing the application and walking the stack to ensure safe splicing for each instrumentation request.
Static binary rewriters such as EEL [12] and ATOM [20] are fine-grained and allow arbitrary code to be inserted into user programs (and potentially to kernels). Because static rewriting requires the program to be taken off-line during instrumentation, one must instrument everything in case it may turn out to be of interest. By contrast, dynamic instrumentation allows the user to refine, at runtime, what instrumentation is of interest.
Kitrace [11] traces kernel code locations. It replaces instructions being traced with a trap, which transfers control to a custom handler. This handler appends an entry to the trace log and resumes execution. Because trap instructions can be inserted at most kernel instructions, kitrace is fine-grained. Kitrace differs from our work in several ways: it requires a kernel recompile; it does not insert general code into the kernel; and its method of resuming execution after a trap is more expensive than in dynamic instrumentation. Fine-grained dynamic instrumentation subsumes kitrace because it can insert arbitrary code, not just trace-gathering code.
SLIC [8] provides extensibility in commodity operating systems by rerouting events crossing certain kernel interfaces (system calls, signals, and virtual memory routines) to extensions that have either been downloaded into the kernel, or run in a user-level process. SLIC interposes extensions on kernel interfaces by rewriting jump tables or through binary patching of kernel routines. When it performs binary patching, SLIC replaces several instructions at the start of a kernel function; as we have seen in Section 3.4.2, multiple-instruction patching is unsafe. In addition, SLIC is not fine-grained; for example, interposing system calls provides for only a few dozen kernel instrumentation points.
While KernInst opens up many areas of opportunity, for general use, it creates safety and security concerns. We are currently formulating a formal access and control model, with the goal of automating much of the checking the dynamic code.
For more information, see https://www.cs.wisc.edu/paradyn/.
|
This paper was originally published in the
Proceedings of the Third Symposium on Operating Systems Design and Implementation, February 22-25, 1999, New Orleans, Louisiana, USA
Last changed: 26 Mar 2002 ml |
|