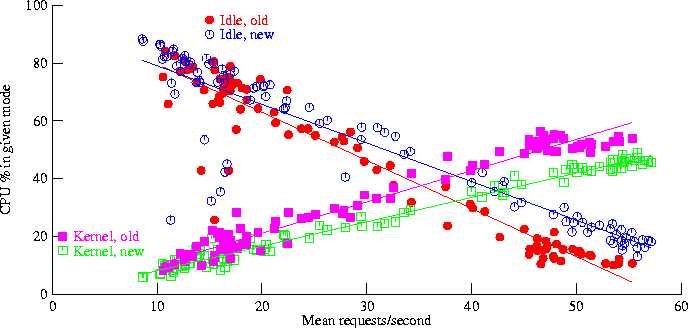
Figure 9: CPU costs as a function of request rate
The operating system maintains counts of the number of clock interrupts that occur in each system mode (user-mode, kernel-mode, and idle). During the course of each trial, we logged these counters every 15 minutes, which allowed us to reconstruct the mean time spent in each mode during the 15 minutes prior to each log entry. The proxy software creates a timestamped log entry for each HTTP request it receives, so we can also count the number of requests handled in each 15 minute period, and then compute the mean request rate over that period.
Figure 9 shows how CPU idle time, and CPU kernel-mode time, vary as a function of the mean request rate. Each point on the scatterplot represents one 15-minute sample. The circles correspond to idle time; the squares correspond to kernel-mode time. The filled marks show performance with the old versions of both select() and ufalloc() (the trial of 1998-04-16). The open marks show the performance of the new implementations (the trial of 1998-04-23).
We then computed linear regressions for each set of samples. The regression lines are shown in Figure 9; the numeric results are given in Table 4. (User-mode regressions are given in the table, but not shown in the figure.) Each sample set includes 96 points (24 hours of 15-minute samples). The correlation between kernel-mode time and request rate is quite close; the correlation for idle time is not quite as good, probably because of some outliers caused by daily ``housekeeping'' tasks done during periods of low request rate. Because the outliers all occur at low request rates (that is, late at night), we recalculated the regressions after excluding samples taken at rates below 20 requests/second. These regressions, shown in Table 5, show higher correlation coefficients for idle time and user-mode time.
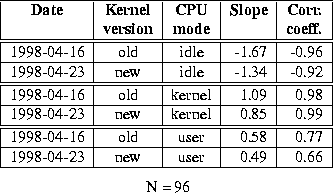
Table 4: Linear regressions: full 1-day data sets

Table 5: Linear regressions: above 20 requests/second
The regressions for idle time and kernel-mode time show significantly steeper slopes for the unmodified kernel, compared to those for the new implementations of select() and ufalloc(). The regressions for user-mode time suggest that the new kernel performs slightly better, perhaps because of better data-cache utilization, but the difference might not be significant.
Although one cannot necessarily expect linear behavior at very high request rates, a linear extrapolation of the idle time regressions from the full data sets gives X-intercepts of 58 requests/sec. for the unmodified kernel, and 69 requests/sec. for the new implementation. Using the truncated data sets (Table 5), the calculated X-intercepts are 57 and 68 requests/sec., respectively. This suggests that the modified kernel might support a peak request rate about 19% higher than the unmodified kernel, in this application.
Note that our samples were averaged over 15-minute intervals. The actual one-second peak rates experienced during these trials (see Table 3) were 107 requests/sec. for the unmodified kernel, and 116 requests/sec. for the modified kernel. Clearly, the systems can support rates higher than the extrapolation of idle time implies. The main significance of our performance improvements may be not the increase in peak throughput, but the decrease in queueing delay (and response time) at high throughputs.