As mentioned in the beginning of this section, Semi-preemptible IO greatly relies on disk profiling to obtain accurate disk parameters. The disk profiler obtains the following required disk parameters:
As regards chunking, the disk profiler provides the optimal
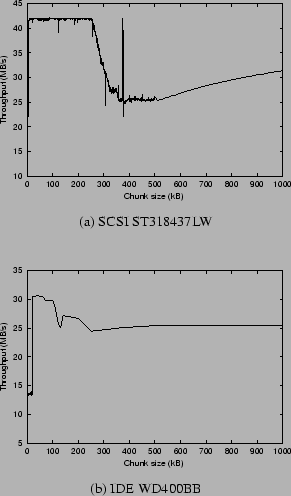
range for the chunk size. Figure 5 depicts the effect
of chunk size on the read throughput performance for one SCSI and one
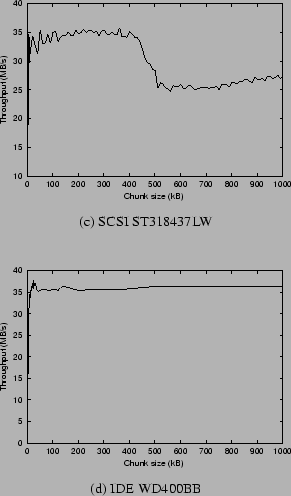
IDE disk drive. Figure 6 shows the same for the write
case. Clearly, the optimal range for the chunk size (between the points
![]() and
and ![]() illustrated previously in Figure 3) can be
automatically extracted from these figures. The disk profiler
implementation was successful in extracting the optimal chunk size for
several SCSI and IDE disk drives with which we experimented. For those
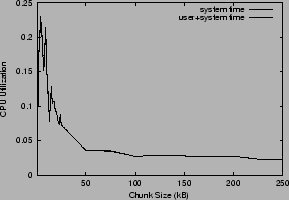
who might also be interested in the CPU overhead for performing
chunking, we present the CPU utilization when transferring a large data
segment from the disk, using different chunk sizes in
Figure 7 for an IDE disk. The CPU
utilization decreases rapidly with an increase in the chunk size.
Beyond a chunk size of
illustrated previously in Figure 3) can be
automatically extracted from these figures. The disk profiler
implementation was successful in extracting the optimal chunk size for
several SCSI and IDE disk drives with which we experimented. For those
who might also be interested in the CPU overhead for performing
chunking, we present the CPU utilization when transferring a large data
segment from the disk, using different chunk sizes in
Figure 7 for an IDE disk. The CPU
utilization decreases rapidly with an increase in the chunk size.
Beyond a chunk size of ![]() kB, the CPU utilization remains
relatively constant.
This figure shows that chunking, using even
small chunk size (
kB, the CPU utilization remains
relatively constant.
This figure shows that chunking, using even
small chunk size (![]() kB), is feasible for IDE disk without incurring
any significant CPU overhead.
For SCSI disks, the CPU overhead of chunking is even less than that
for IDE disks, since the bulk of the processing is done by the SCSI
controller.
kB), is feasible for IDE disk without incurring
any significant CPU overhead.
For SCSI disks, the CPU overhead of chunking is even less than that
for IDE disks, since the bulk of the processing is done by the SCSI
controller.
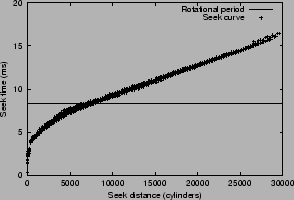
To perform JIT-seek, the system needs an accurate estimate of the seek
delay between two disk blocks. The disk profiler provides the seek
curve as well as the variations in seek time. The seek time curve (and
variations in seek time) for a SCSI disk obtained by the disk profiler
is presented in Figure 8. The disk profiler also
obtains the required parameters for rotational delay prediction between
accessing two disk blocks in succession with near-microsecond-level
precision. However, the variations in seek
time can be of the order of one millisecond, which restricts the possible
accuracy of prediction.
Finally, to perform JIT-seek, the system combines seek time and
rotational delay prediction to predict ![]() .
We have conducted more detailed study on
.
We have conducted more detailed study on ![]() prediction in [7].
prediction in [7].