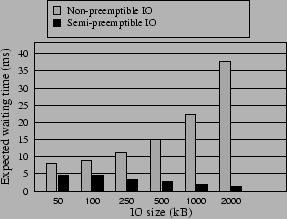
Figure 9 depicts the difference in the expected waiting time between non-preemptible IO and Semi-preemptible IO. In this experiment, IOs were serviced for data situated at random locations on the disk. The IOs were serviced using FCFS policy. We can see that the expected waiting time for non-preemptible IOs increases linearly with IO size due to increased data transfer time. However, the expected waiting time for Semi-preemptible IOs actually decreases with IO size, since the disk spends more time in data transfer, which is more preemptible.
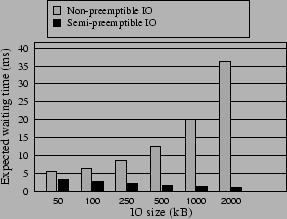
Figure 10 depicts the improvements in the expected waiting
time when the system uses an elevator-based scheduling policy. (The figure
shows the results of randomly generated IO requests serviced in
batches of ![]() .) The results are better than those of FCFS access since
the elevator scheduler reduces the seek component that is the least-preemptible.
.) The results are better than those of FCFS access since
the elevator scheduler reduces the seek component that is the least-preemptible.
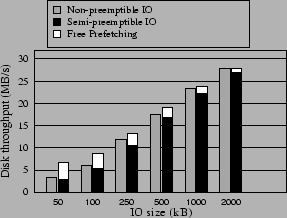
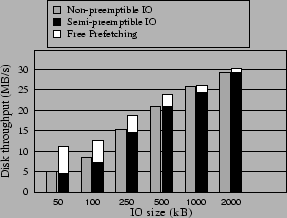
Figures 11 and 12 show the effect of improving IO
preemptibility on the achieved disk throughput when an FCFS scheduling
policy is used. There is a noticeable but minor reduction in disk throughput
using Semi-preemptible IO (less than ![]() ).
This reduction is due to the overhead of seek-splitting
and mis-prediction of seek and rotational delay.
More details on the accuracy of rotational delay predictions
can be found in [7].
Another point worth mentioning is that the reduction in disk
throughput in Semi-preemptible IO is smaller for large IOs than for small IOs
due to the reduced number of seeks and hence the smaller overhead.
).
This reduction is due to the overhead of seek-splitting
and mis-prediction of seek and rotational delay.
More details on the accuracy of rotational delay predictions
can be found in [7].
Another point worth mentioning is that the reduction in disk
throughput in Semi-preemptible IO is smaller for large IOs than for small IOs
due to the reduced number of seeks and hence the smaller overhead.
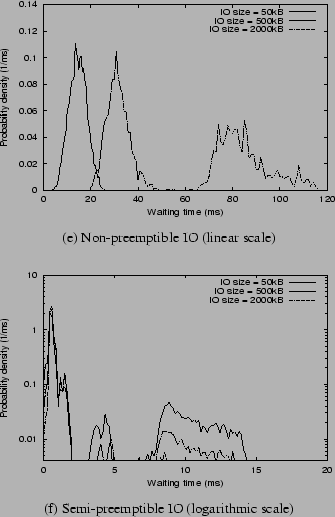
Since disk commands are non-preemptible (even in Semi-preemptible IO), we can use the duration of disk commands to measure the expected waiting time. A smaller value implies a more preemptible system. Figure 13 shows the distribution of the durations of disk commands for both non-preemptible IO and Semi-preemptible IO (for exactly the same sequence of IO requests). In the case of non-preemptible IO (Figure 13 (a)), one IO request is serviced using a single disk command. Hence, the disk access can be preempted only when the current IO request is completed. The distribution is dense near the sum of the average seek time, rotational delay, and transfer time required to service an entire IO request. The distribution is wider when the IO requests are larger, because the duration of data transfer depends not only on the size of the IO request, but also on the throughput of the disk zone where the data resides.
In the case of Semi-preemptible IO, the distribution of the durations of disk
commands does not directly depend on the IO request size, but on individual
disk commands used to perform an IO request. (We plot the
distribution for the Semi-preemptible IO case in logarithmic scale, so that the
probability density of longer disk commands can be better visualized.)
In Figure 13 (b), we see that for Semi-preemptible IO,
the largest probability density is around the time required to
transfer a single chunk of data. If the chunk includes the track or
cylinder skew, the duration of the command will be slightly longer.
(The two peaks immediately to the right of the highest peak, at
approximately ![]() ms, have the same probability because the disk used
in our experiments has two tracks per cylinder.) The part of the
distribution between
ms, have the same probability because the disk used
in our experiments has two tracks per cylinder.) The part of the
distribution between ![]() ms and
ms and ![]() ms in the figure is due to the
combined effect of JIT-seek and seek-splitting on the seek and
rotational delays. The probability for this range is small,
approximately
ms in the figure is due to the
combined effect of JIT-seek and seek-splitting on the seek and
rotational delays. The probability for this range is small,
approximately ![]() ,
, ![]() , and
, and ![]() for
for ![]() kB,
kB, ![]() kB, and
kB, and
![]() kB IO requests, respectively.
kB IO requests, respectively.
 |