
 (a)
(a) |
 (b)
(b) |
 (c)
(c) |
 (d)
(d) |
 (e)
(e) |
 (f)
(f) |
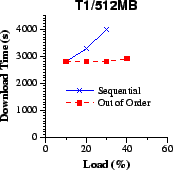
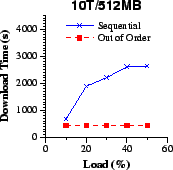
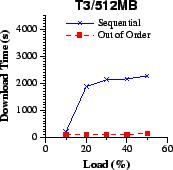
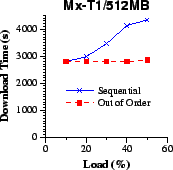
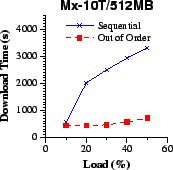
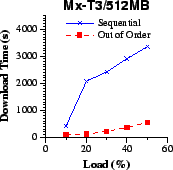
| Figure 10: With out-of-order transfers, download requests take almost constant time to complete as the load increases. When file data transfers are served sequentially, however, the download duration increases significantly as a function of the system load. We consider the case where all clients have the same network link capacity (a-c), and when clients of different link capacities are served by a single server (d-f). | |
A key challenge in the design of a download server is to adapt automatically to different client rates without manual tuning. The closer the transfer rates of two clients match, the easier it becomes to exploit the data sharing among them. As the difference increases, it becomes more difficult to share cached data effectively.
Figure 8 depicts the network throughput of an unmodified (sequential) and a Circus (out-of-order) server as clients with different rates download a single file of size 512MB. In typical ftpd implementations (including the one that we use here), each active download request spawns an extra server process with resident memory space of about 1MB. Consequently, we show only T1 measurements for up to 30-40% load, roughly corresponding to about 200 concurrent clients. Beyond this point memory paging interferes with the measurements.
In all the three cases of a single client link rate (a-c), the out-of-order network throughput increases proportionally with the system load. In particular, at 40% load, we expect to receive 51.2MByte/s throughput, which is roughly what we observe in cases (b) and (c). The measured throughput is somewhat lower (in case d) with clients of different rates on the same server, but still reaches 50MByte/s at 50% load. Quite remarkably, the sequential system only matches the out-of-order performance at 10% load in the four cases, and never exceeds 30MByte/s (on average) as the load increases.
Figure 9 shows disk throughput for the same experiment. With sequential transfers, the disk is highly utilized even at low loads, regardless of the client rates. In contrast, with out-of-order transfers (a-c) the disk throughput drops to the transfer rate of a single client. For example the disk throughput is about 1MByte/s with 10T transfers (b), an order of magnitude lower than the sequential case. When we mix clients of different capacities (d), this behavior holds at low loads with the disk throughput about 5.6 MByte/s. At higher loads, the proportion of non-sharing (independent) clients increases, raising the disk throughput accordingly. Figure 10 further verifies these observations. With out-of-order transfers, the download latencies remain roughly constant at different system loads, according to the client rates. But when sequential transfers are used, the download latency increases rapidly with the system load.
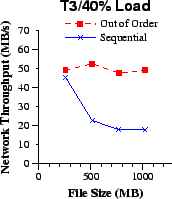
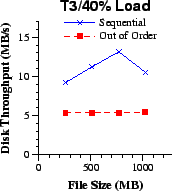
This section investigates how the file size affects the system performance. Figure 11(a) shows the server network throughput in a file size range between 256MB and 1GB. We observe that, with out-of-order transfers, the network throughput remains above 50MByte/s, consistent with the 40% offered load. Sequential transfers cause the network throughput to drop below 20MByte/s, approaching the disk throughput. As a result, download latency (not shown) increases dramatically for sequential transfers to several tens of minutes. For the out-of-order case all downloads complete within a few minutes at all the file sizes that we examined.
 (a)
(a) |
 (b)
(b) |
| Figure 11: Server network throughput and disk throughput for transfers along T3 links of a file with size between 256MB and 1GB. The system load is set equal to 40%. With out-of-order transfers the the network throughput is always higher and the disk throughput is constant regardless of the size of the file. | |
 (a)
(a) |
 (b)
(b) |
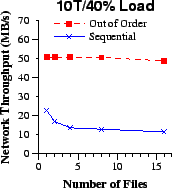
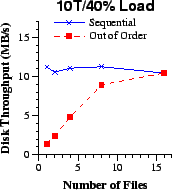
| Figure 12: Server network throughput and disk throughput when the number of concurrently requested files varies from 1 to 16. The system load is 40% and the file size is always 512MB. All files are requested with equal probability. | |
![\begin{figure*}\mbox{\subfigure[]{\centering\epsfig{file=cfi/loss-dur.eps, width...
...ubfigure[]{\centering\epsfig{file=cfi/loss-mr.eps,width=2.5in} }}\end{figure*}](figs/img42.gif)
|
| Figure 13: In the base case we assume round-trip delay less than 1ms and packet loss close to 0%. In the delay case we increase the round-trip delay to 75ms and in the loss case we increase the loss rate to 10%, correspondingly, with respect to the base case. Both the download time and the miss ratio of sequential and out-of-order transfers can be affected when combining round-trip delay of 75ms with packet loss rate of 10% (delay+loss). T1 and T3 links are used with equal probability to connect a single server to multiple clients. |
Even though it is likely that only a few files will be in heavy demand by the clients, we investigate how the performance of the system is affected when the number of popular files increases. We consider 1 to 16 different files of 512 MB each, all stored on a single server disk, and requested with equal probability. The clients receive data over 10Mbit/s links, and the system is at 40% load. In Figure 12(a), we illustrate the network throughput of the server with sequential and out-of-order transfers respectively. In the out-of-order case, the measured throughput remains roughly 50 MByte/s with up to 8 files, and drops slightly to 48MB/s with 16 files. From Figure 12(b), the average disk throughput increases linearly with the number of files up to eight, and reaches 10MB/s at 16 files. This behavior is expected because the number of disk access streams increases with more active files, and the disk throughput begins to limit the system as it approaches 10MByte/s. With sequential transfers, the disk throughput always limits the system and performance only worsens as the number of files increases.
 (a)
(a) |
 (b)
(b) |
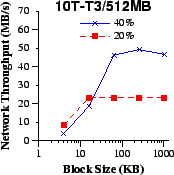
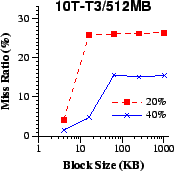
| Figure 14: We examine the sensitivity of the system to the block size parameter, when mixing equiprobable requests from clients with 10T and T3 links requesting a file of 512MB at system load 20% and 40%. Both the network throughput and the miss ratio are adversely affected by block sizes smaller than 64KB, but remain insensitive to larger values. | |
 (a)
(a) |
 (b)
(b) |
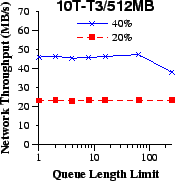
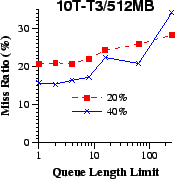
| Figure 15: We investigate the effect of the queue length limit, when mixing equiprobable requests from clients with 10T and T3 links for a 512MB file at different loads. As the queue length limit increases, the disk throughput also grows leading to higher miss ratio. Eventually, the disk bandwidth becomes bottleneck which makes the server network throughput to drop. | |
Packet loss rate and propagation delay can vary significantly in a
wide-area network depending on the physical span and the operating
conditions of the network. We investigated the impact of such factors
to file transfers by experimenting with round-trip times of about 1and 75 ms, and with packet loss rates about ![]() and 10%,
respectively, using Dummynet. In Figure 13, we measure
the download time and server miss ratio when transferring a 512MB file
over T1 and T3 links from the same server. When packet loss of 10%
and delay of 75ms are combined in out-of-order transfers, download
time over T3 links increases by an order of magnitude approaching the
level of sequential transfers. This ten-fold increase from the base
case can be attributed to the mechanism used by the congestion
avoidance algorithm to recover the congestion window at the sender.
and 10%,
respectively, using Dummynet. In Figure 13, we measure
the download time and server miss ratio when transferring a 512MB file
over T1 and T3 links from the same server. When packet loss of 10%
and delay of 75ms are combined in out-of-order transfers, download
time over T3 links increases by an order of magnitude approaching the
level of sequential transfers. This ten-fold increase from the base
case can be attributed to the mechanism used by the congestion
avoidance algorithm to recover the congestion window at the sender.
Longer round-trip delays increase the recovery time and the wasted network bandwidth. This can be explained by the TCP operation: packet losses lead to triple duplicate acknowledgments (rather than timeouts), and the congestion window increases by at most one data segment every round-trip time [21]. Individual sequential transfers have low throughput due to the disk bottleneck, and are not affected further at low load. However, raising the system load from 10% to 30% doubles the time of T3 sequential transfers, while leaving the out-of-order transfer time almost unchanged. When combining delay and loss with out-of-order transfers, disk throughput drops because data retransmissions hit in the buffer cache. We don't observe similar effects for sequential transfers, which provides additional evidence about the poor disk access locality of this policy.
 (a)
(a) |
 (b)
(b) |
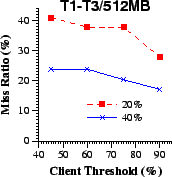
| Figure 16: We examine the sensitivity of the system performance to the client threshold when mixing download requests over T1 and T3 network links. We found the client thresholds equal to 75% or higher to keep both the download time over T3 links and the miss ratio low. | |
 (a)
(a) |
 (b)
(b) |
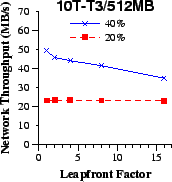
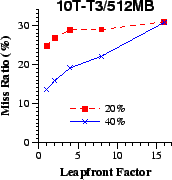
| Figure 17: We show the effect of the leapfront factor using equiprobable download requests over 10T and T3 lines at different system loads. As the leapfront factor increases, network throughput drops and miss ratio surges, especially at high system load. | |
This section examines how sensitive the system behavior is to important configuration parameters. We did extensive experimentats to ensure that the system remains robust across a wide range of workloads, but we include only a few representative measurements here. Overall, the system behavior is affected by the configuration parameters below, but remains stable when the parameters remain within the ranges that we suggest.