|

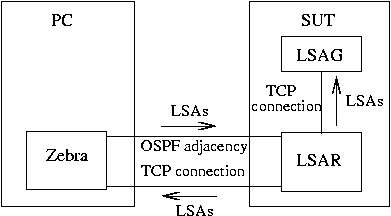
Our experimental setup consists of two hosts as shown in Figure 4. The host denoted by SUT (System Under Test) runs the LSAR and LSAG. The other host runs a modified version of Zebra [19]. The modifications include the ability to emulate a desired OSPF topology and changes to it by sending appropriate LSAs over an OSPF adjacency, and the ability to form an LSAG session with the LSAR to receive LSAs.
With this setup, we start an experiment by loading
the desired topology into the LSAR running on the SUT.
We use a fully connected graph having
![]() nodes as the emulated topology.
Once the desired topology is loaded at the LSAR, Zebra sends out a burst
of back-to-back LSAs to the LSAR;
we will denote the number of LSAs in a burst by
nodes as the emulated topology.
Once the desired topology is loaded at the LSAR, Zebra sends out a burst
of back-to-back LSAs to the LSAR;
we will denote the number of LSAs in a burst by
![]() .
These bursts are repeated such that there is a gap
of inter-burst time (
.
These bursts are repeated such that there is a gap
of inter-burst time (
![]() )
between the
beginning of successive bursts.
Thus, every experiment instance consists of four input parameters:
the number of nodes (
)
between the
beginning of successive bursts.
Thus, every experiment instance consists of four input parameters:
the number of nodes (
![]() )
in the fully connected graph,
the number of LSAs in a burst (
)
in the fully connected graph,
the number of LSAs in a burst (
![]() ),
inter-burst time (
),
inter-burst time (
![]() ),
and the number of bursts (
),
and the number of bursts (
![]() ).
).
Each LSA in a burst results in changing the status of
all
![]() adjacencies of a router from up to
down or from down to up.
During a burst, we cycle through routers while sending the LSAs out.
For example, if
adjacencies of a router from up to
down or from down to up.
During a burst, we cycle through routers while sending the LSAs out.
For example, if
![]() and
and
![]() ,
the four LSAs sent out would result in the following events:
(i) bring down all adjacencies of router 1,
(ii) bring down all adjacencies of router 2,
(iii) bring up all adjacencies of router 1,
and (iv) bring up all adjacencies of router 2.
We believe that using a fully connected graph, flapping
adjacencies of routers, and sending out bursts of LSAs
stresses the LSAR and LSAG most in terms of resources.
,
the four LSAs sent out would result in the following events:
(i) bring down all adjacencies of router 1,
(ii) bring down all adjacencies of router 2,
(iii) bring up all adjacencies of router 1,
and (iv) bring up all adjacencies of router 2.
We believe that using a fully connected graph, flapping
adjacencies of routers, and sending out bursts of LSAs
stresses the LSAR and LSAG most in terms of resources.
To characterize the LSAR performance,
we measure how quickly it can send out
an LSA received over an OSPF adjacency to the LSAG.
Recall that our modified Zebra is capable of
forming an LSAG session with the LSAR.
This allows us to record the necessary time-stamps within Zebra itself
thereby obviating the need for running a separate LSAG process on the Zebra PC.
For each LSA, Zebra records the time when it sends the LSA over the adjacency,
and the time when it receives the LSA back over the LSAG session.
We will denote the mean of the difference between the send-time
and receive-time for an LSA by
![]() .
For the LSAG, we measure how long it takes the LSAG to process every LSA.
To measure this, we instrumented the LSAG code to record the time before
and after every LSA is processed.
We will denote the mean LSA processing time at the LSAG by
.
For the LSAG, we measure how long it takes the LSAG to process every LSA.
To measure this, we instrumented the LSAG code to record the time before
and after every LSA is processed.
We will denote the mean LSA processing time at the LSAG by
![]() .
.
Long duration LSA bursts can cause the LSAR to lose LSA instances
occasionally.
Despite OSPF's reliable flooding, most of these losses are irrecoverable
if the lost instance is ``overwritten'' by a new instance of the LSA before
the retransmission timer expires.
Therefore, we measure the number of LSAs lost during each experiment
by calculating the fraction of LSAs that were sent by
Zebra to the LSAR but never received back.
We will denote this quantity by
![]() .
.