 |

DeBox is designed to bridge the divide in performance analysis across the kernel and user boundary by exposing kernel performance behavior to user processes, with a focus on server-style applications with demanding workloads. In these environments, performance problems can occur on either side of the boundary, and limiting analysis to only one side potentially eliminates useful information.
We present our observations about performance analysis for server applications as below. While some of these measurements could be made in other ways, we believe that DeBox's approach is particularly well-suited for these environments. Note that replacing any of the existing tools is an explicit non-goal of DeBox, nor do we believe that such a goal is even feasible.
High overheads hide bottlenecks. The cost of the debugging tools
may artificially stress parts of the system, thus masking the real
bottleneck at higher load levels. Problems that appear only at high
request rates may not appear when a profiler causes an overall
slowdown. Our tests show that for server workloads, kernel gprof
has 40% performance degradation even when low resolution profiling is
configured. Others tracing and event logging tools generate large
quantities of data, up to 0.5MB/s in Linux Trace
Toolkit (42). For more demanding workloads, the
CPU or filesystem effects of these tools may be problematic.
We design DeBox not only to exploit hardware performance counters to reduce overhead, but also to allow users to specify the level of detail to control the overall costs. Furthermore, by splitting the profiling policy and mechanism in DeBox, applications can decide how much effort to expend on collecting and storing information. Thus, they may selectively process the data, discard redundant or trivial information, and store only useful results to reduce the costs. Not only does this approach make the cost of profiling controllable, but one process desiring profiling does not affect the behavior of others on the system. It affects only its own share of system resources.
User-level timing can be misleading.
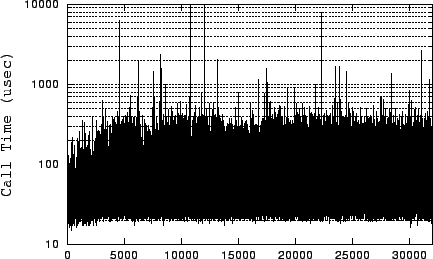
Figure 1 shows user-level timing measurement of
the sendfile() system call in an event-driven server. This
server uses nonblocking sockets and invokes sendfile only for
in-memory data. As a result, the high peaks on this graph are
troubling, since they suggest the server is blocking. A similar
measurement using getrusage() also falsely implies the same.
Even though the measurement calls immediately precede and follow the
system call, heavy system activity causes the scheduler to preempt the
process in that small window.
 |
In DeBox, we integrate measurement into the system call process, so it does not suffer from scheduler-induced measurement errors. The DeBox-derived measurements of the same call are shown in Figure 2, and do not indicate such sharp peaks and blocking. Summary data for sendfile and accept (in non-blocking mode) are shown in Table 1.
Statistical methods miss infrequent events. Profilers and
monitoring tools may only sample events, with the belief that any
event of interest is likely to take ``enough'' time to eventually be
sampled. However, the correlation between frequency and importance may
not always hold. Our experiments with the Flash web server indicate
that adding a 1 ms delay to one out of every 1000 requests can degrade
latency by a factor of 8 while showing little impact on throughput.
This is precisely the kind of behavior that statistical profilers are
likely to miss.
We eliminate this gap by allowing applications to examine every system call. Applications can implement their own sampling policy, controlling overhead while still capturing the details of interest to them.
Data aggregation hides anomalies. Whole-system profiling and
logging tools may aggregate data to keep completeness and reduce
overhead at the same time. This approach makes it hard to determine
which call invocation experienced problems, or sometimes even which
process or call site was responsible for high-overhead calls.
This problem gets worse in network server environments where
the systems are complex and large quantities of data are generated.
It is not uncommon for these applications to have dozens of system
call sites and thousands of invocations per second. For example, the
Flash server consists of about 40 system calls and 150 calling
sites. In these conditions, either discarding call history or logging
full events is infeasible.
By making performance information a result of system calls, developers have control over how the kernel profiling is performed. Information can be recorded by process and by call site, instead of being aggregated by call number inside the kernel. Users may choose to save accumulated results, record per-call performance history over time, or fully store some of the anomalous call trace.
Out-of-band reporting misses useful opportunities. As the
kernel-user boundary becomes a significant issue for demanding
applications, understanding the interaction between operating systems and user
processes becomes essential.
Most existing tools provide measurements out-of-band,
making online data processing harder and
possibly missing useful opportunities.
For example, the online method allows an application to abort()
or record the status when a performance anomaly occurs, but it is
impossible with out-of-band reporting.
When applications receive performance information tied to each system call via in-band channels, they can choose the filtering and aggregation appropriate for the program's context. They can easily correlate information about system calls with the underlying actions that invoke them.