 |

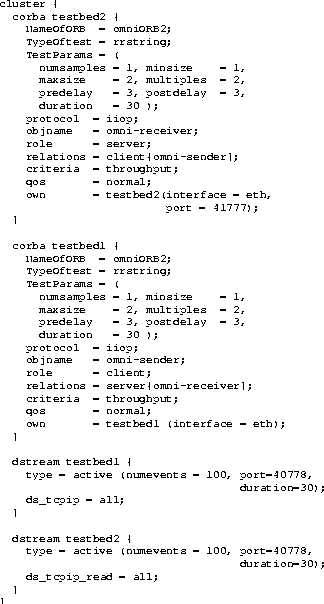
This section briefly illustrates the use of the DSKI to gather performance information from the operating system during a test using the simple client-server pattern discussed in Section 4.1. As discussed in Section 3 the DSKI creates a stream of time stamped records for each occurrence of a predefined event in the operating system kernel. The set of event records produced can be post-processed to calculate the time spent in providing different types of system services. In this case, the time spent in various portions of the TCP/IP stack can be calculated because we have defined a set of events capable of tracing the progress of packets through the TCP/IP stack. Figure 13 presents the NetSpec PMO script implementing the experiment.
Figure 14 presents the packet flow in and out of the Sender and Receiver hosts, as well as the performance figures from the kernel obtained using the DSKI. The socket, TCP, IP, and Ethernet layers are numbered 1 through 4 on the sending host, and 5 through 8 from the bottom up on the receiver host. The path of a packet sent from the sender to the receiver in the diagram would thus flow through layers in numerical order. The bar graph in Figure 14 shows the time in microseconds spent by a packet in each layer, by number.
This experiment demonstrates that the DSKI provides the ability to gather fine grain operating system level time stamped events. Note that the Y-axis in Figure 14 is a logarithmic scale, showing that we were able to monitor time intervals ranging from 10 microseconds to 10 milliseconds. It also illustrates an important feature of the DSKI which we call tagging. Each event in the operating system can include a context dependent tag when it logs the event. In the case of tracing TCP/IP performance we used the port and sequence numbers to uniquely identify each packet as it moves among protocol layers on each machine.
A similar approach would be used to investigate how buffer size affects throughput under the proxy pattern. DSKI events could be used to monitor when and how packets are transmitted, combined or broken into fragments, and what size system buffers are used to hold them. Tagging would be used to determine the progress of each packet, and would tell us if the buffer size influenced protocol behavior. Monitoring at the system level might also tell us something about the middleware, even without explicit instrumentation. If, for example, buffers of one size were given to the CORBA layer, but buffers of a different size were passed onto the system layer we would know that the middleware was manipulating the data buffers.
The DSKI can thus be used to investigate a wide range of interactions between the operating system and software layers using its services. This is by no means a simple endeavor, since it requires access to the system source code and sufficient knowledge of the system to enable the investigator to define a reasonable set of events, and then to interpret the results. However, for the investigator willing to learn how to use it well, it can provide an important new source of detailed information from the operating system layer which plays an important role in determining what aspects of endsystem architecture limit application performance under various sets of execution conditions.