| ||||||||||||||||||||||||||||||||||||||||||||||||||||
|
FAST '04 Paper
[FAST '04 Technical Program]
Atropos: A Disk Array Volume Manager for Orchestrated Use of DisksJiri Schindler[*], Steven W. Schlosser, Minglong Shao,
Anastassia Ailamaki, Gregory R. Ganger
Abstract:
The Atropos logical volume manager allows applications to exploit
characteristics of its underlying collection of disks. It stripes
data in track-sized units and explicitly exposes the boundaries,
allowing applications to maximize efficiency for sequential access
patterns even when they share the array. Further, it supports
efficient diagonal access to blocks on adjacent tracks, allowing
applications to orchestrate the layout and access to two-dimensional
data structures, such as relational database tables, to maximize
performance for both row-based and column-based accesses.
1 IntroductionMany storage-intensive applications, most notably database systems and scientific computations, have some control over their access patterns. Wanting the best performance possible, they choose the data layout and access patterns they believe will maximize I/O efficiency. Currently, however, their decisions are based on manual tuning knobs and crude rules of thumb. Application writers know that large I/Os and sequential patterns are best, but are otherwise disconnected from the underlying reality. The result is often unnecessary complexity and inefficiency on both sides of the interface. Today's storage interfaces (e.g., SCSI and ATA) hide almost everything about underlying components, forcing applications that want top performance to guess and assume [7,8]. Of course, arguing to expose more information highlights a tension between the amount of information exposed and the added complexity in the interface and implementations. The current storage interface, however, has remained relatively unchanged for 15 years, despite the shift from (relatively) simple disk drives to large disk array systems with logical volume managers (LVMs). The same information gap exists inside disk array systems--although their LVMs sit below a host's storage interface, most do not exploit device-specific features of their component disks. This paper describes a logical volume manager, called Atropos (see Figure 1), that exploits information about its component disks and exposes high-level information about its data organization. With a new data organization and minor extensions to today's storage interface, it accomplishes two significant ends. First, Atropos exploits automatically-extracted knowledge of disk track boundaries, using them as its stripe unit boundaries. By also exposing these boundaries explicitly, it allows applications to use previously proposed ``track-aligned extents'' (traxtents), which provide substantial benefits for mid-sized segments of blocks and for streaming patterns interleaved with other I/O activity [22].
Second, Atropos uses and exposes a data organization that lets applications go beyond the ``only one dimension can be efficient'' assumption associated with today's linear storage address space. In particular, two-dimensional data structures (e.g., database tables) can be laid out for almost maximally efficient access in both row- and column-orders, eliminating a trade-off [15] currently faced by database storage managers. Atropos enables this by exploiting automatically-extracted knowledge of track/head switch delays to support semi-sequential access: diagonal access to ranges of blocks (one range per track) across a sequence of tracks. In this manner, a relational database table can be laid out such that scanning a single column occurs at streaming bandwidth (for the full array of disks), and reading a single row costs only 16%-38% more than if it had been the optimized order. We have implemented Atropos as a host-based LVM, and we evaluate it with both database workload experiments (TPC-H) and analytic models. Because Atropos exposes its key parameters explicitly, these performance benefits can be realized with no manual tuning of storage-related application knobs. The rest of the paper is organized as follows. Section 2 discusses current logical volume managers and the need for Atropos. Section 3 describes the design an implementation of Atropos. Section 4 describes how Atropos is used by a database storage manager. Section 5 evaluates Atropos and its value for database storage management. Section 6 discusses related work. 2 BackgroundThis section overviews the design of current disk array LVMs, which do not exploit the performance benefits of disk-specific characteristics. It highlights the features of the Atropos LVM, which addresses shortcomings of current LVMs, and describes how Atropos supports efficient access in both column- and row-major orders to applications accessing two-dimensional data structures. 2.1 Conventional LVM designCurrent disk array LVMs do not sufficiently exploit or expose the unique performance characteristics of their individual disk drives. Since an LVM sits below the host's storage interface, it could internally exploit disk-specific features without the host being aware beyond possibly improved performance. Instead, most use data distribution schemes designed and configured independently of the underlying devices. Many stripe data across their disks, assigning fixed-sized sets of blocks to their disks in a round-robin fashion; others use more dynamic assignment schemes for their fixed-size units. With a well-chosen unit size, disk striping can provide effective load balancing of small I/Os and parallel transfers for large I/Os [13,16,18]. A typical choice for the stripe unit size is 32-64 KB. For example, EMC's Symmetrix 8000 spreads and replicates 32 KB chunks across disks [10]. HP's AutoRAID [25] spreads 64 KB ``relocation blocks'' across disks. These values conform to the conclusions of early studies [4] of stripe unit size trade-offs, which showed that a unit size roughly matching a single disk track (32-64 KB at the times of these systems' first implementations) was a good rule-of-thumb. Interestingly, many such systems seem not to track the growing track size over time (200-350 KB for 2002 disks), perhaps because the values are hard-coded into the design. As a consequence, medium- to large-sized requests to the array result in suboptimal performance due to small inefficient disk accesses. 2.2 Exploiting disk characteristicsTrack-sized stripe units: Atropos matches the stripe unit size to the exact track size of the disks in the volume. In addition to conforming to the rule-of-thumb as disk technology progresses, this choice allows applications (and the array itself [11]) to utilize track-based accesses: accesses aligned and sized for one track. Recent research [22] has shown that doing so increases disk efficiency by up to 50% for streaming applications that share the disk system with other activity and for components (e.g., log-structured file systems [17]) that utilize medium-sized segments. In fact, track-based access provides almost the same disk efficiency for such applications as would sequential streaming. The improvement results from two disk-level details. First, firmware support for zero-latency access eliminates rotational latency for full-track accesses; the data of one track can be read in one revolution regardless of the initial rotational offset after the seek. Second, no head switch is involved in reading a single track. Combined, these positioning delays represent over a third of the total service time for non-aligned, approximately track-sized accesses. Using small stripe unit sizes, as do the array controllers mentioned above, increases the proportion of time spent on these overheads. Atropos uses automated extraction methods described in previous work [21,22] to match stripe units to disk track boundaries. As detailed in Section 3.3, Atropos also deals with multi-zoned disk geometries, whereby tracks at different radial distances have different numbers of sectors. that are not multiples of any useful block size.
Efficient access to non-contiguous blocks: In addition to exploiting disk-specific information to determine its stripe unit size, Atropos exploits disk-specific information to support efficient access to data across several stripe units mapped to the same disk. This access pattern, called semi-sequential, reads some data from each of several tracks such that, after the initial seek, no positioning delays other than track switches are incurred. Such access is appropriate for two-dimensional data structures, allowing efficient access in both row- and column-major order. In order to arrange data for efficient semi-sequential access, Atropos must know the track switch time as well as the track sizes. Carefully deciding how much data to access on each track, before moving to the next, allows Atropos to access data from several tracks in one full revolution by taking advantage of the Shortest-Positioning-Time-First (SPTF) [12,23] request scheduler built into disk firmware. Given the set of accesses to the different tracks, the scheduler can arrange them to ensure efficient execution by minimizing the total positioning time. If the sum of the data transfer times and the track switch times equals the time for one rotation, the scheduler will service them in an order that largely eliminates rotational latency (similar to the zero-latency feature for single track access). The result is that semi-sequential accesses are much more efficient than a like number of random or unorchestrated accesses. 2.3 Access to 2D data structures
Figure 2 uses a simple example to illustrate
Atropos's benefits to applications that require efficient access to
two-dimensional structures in both dimensions and contrasts it with
conventional striping in disk arrays.
The example depicts a two-dimensional data structure (e.g., a table of
a relational database) consisting of four columns
To map this two-dimensional structure into a linear space of
LBNs,
conventional systems decide a priori which order (i.e., column- or
row-major) is likely to be accessed most
frequently [5]. In the example in
Figure 2, a column-major access was chosen
and hence the runs of
Accessing data in the other order (i.e., row-major), however, results
in disk I/Os to disjoint
LBNs. For the example in
Figure 2(b), an access to row
Atropos supports efficient access in both orders with a new
data organization, depicted in Figure 2(c). This
layout maps columns such that
their respective first row elements start on the same disk and enable
efficient row-order access. This layout still achieves sequential,
and hence efficient,
column-major access, just like the Naïve layout.
Accessing the row
2.4 Efficient access for database systemsBy mapping two-dimensional structures (e.g., large non-sparse matrices or database tables) into a linear LBN space without providing additional information to applications, efficient accesses in conventional storage systems are only possible in one of row- or column-major order. Database management systems (DBMS) thus predict the common order of access by a workload and choose a layout optimized for that order, knowing that accesses along the other major axis will be inefficient. In particular, online transaction processing (OLTP) workloads, which make updates to full records, favor efficient row-order access. On the other hand, decision support system (DSS) workloads often scan a subset of table columns and get better performance using an organization with efficient column-order access [15]. Without explicit support from the storage device, however, a DBMS system cannot efficiently support both workloads with one data organization.
The different storage models (a.k.a. page layouts) employed by DBMSs
trade the performance of row-major and column-major order
accesses. The page layout prevalent in commercial DBMS, called the
N-ary storage model (NSM), stores a fixed number of full records (all
To alleviate the inefficiency of column-major access with NSM, a
decomposition storage model (DSM) vertically partitions a table into
individual columns [5]. Each DSM page thus contains a
single attribute for a fixed number of records. However,
fetching full records requires The stark difference between row-major and column-major efficiencies for the two layouts described above is so detrimental to database performance that some have even proposed maintaining two copies of each table to avoid it [15]. This solution requires twice the capacity and must propagate updates to each copy to maintain consistency. With Atropos's data layout, which offers efficient access in both dimensions, database systems do not have to compromise. 2.5 A more explicit storage interfaceVirtually all of today's disk arrays use an interface (e.g., SCSI or ATA) that presents the storage device as a linear space of equally-sized blocks. Each block is uniquely addressed by an integer, called a logical block number ( LBN). This linear abstraction hides non-linearities in storage device access times. Therefore, applications and storage devices use an unwritten contract, which states that large sequential accesses to contiguous LBNs are much more efficient than random accesses and small I/O sizes. Both entities work hard to abide by this implicit contract; applications construct access patterns that favor large I/O and LVMs map contiguous LBNs to media locations that ensure efficient execution of sequential I/Os. Unfortunately, an application decides on I/O sizes without any more specific information about the LBN mappings chosen by an LVM because current storage interfaces hide it. In the absence of clearly defined mechanisms, applications rely on knobs that must be manually set by a system administrator. For example, the IBM DB2 relational database system uses the PREFETCHSIZE and EXTENTSIZE parameters to determine the maximal size of a prefetch I/O for sequential access and the number of pages to put into a single extent of contiguous LBNs [6]. Another parameter, called DB2_STRIPED_CONTAINERS, instructs DBMS to align I/Os on stripe unit boundaries. Relying on proper knob settings is fragile and prone to human errors: it may be unclear how to relate them to LVM configuration parameters. Because of these difficulties, and the information gap introduced by inexpressive storage interfaces, applications cannot easily take advantage of significant performance characteristics of modern disk arrays. Atropos exposes explicit information about stripe unit sizes and semi-sequential access. This information allows applications to directly match their access patterns to the disk array's characteristics.
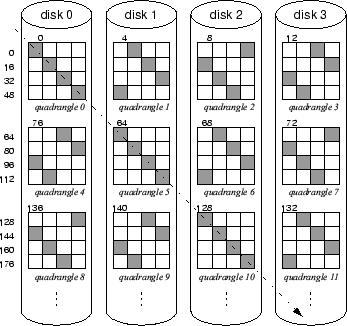
3 Atropos logical volume managerThe Atropos disk array LVM addresses the aforementioned shortcomings of many current disk array LVM designs. It exploits disk-specific characteristics to construct a new data organization. It also exposes high-level features of this organization to higher-levels of the storage stack, allowing them to directly take advantage of key device-specific characteristics. This section details the new data organization and the information Atropos exposes to applications. 3.1 Atropos data organizationAs illustrated in Figure 3, Atropos lays data across p disks in basic allocation units called quadrangles. A quadrangle is a collection of logical volume LBNs, here referred to as VLBNs, mapped to a single disk. Each successive quadrangle is mapped to a different disk. A quadrangle consists of d consecutive disk tracks, with d referred to as the quadrangle's depth. Hence, a single quadrangle is mapped to a contiguous range of a single disk's logical blocks, here referred to as DLBNs. The VLBN and DLBN sizes may differ; a single VLBN consists of b DLBNs, with b being the block size of a single logical volume block. For example, an application may choose a VLBN size to match its allocation units (e.g., an 8 KB database block size), while a DLBN is typically 512 bytes.
Each quadrangle's dimensions are
The goal of the Atropos data organization is to allow efficient access in two dimensions. Efficient access of the primary dimension is achieved by striping contiguous VLBNs across quadrangles on all disks. Much like ordinary disk arrays, which map LBNs across individual stripe units, each quadrangle row contains a contiguous run of VLBNs covering a contiguous run of a single disk's DLBNs on a single track. Hence, sequential access naturally exploits the high efficiency of track-based access explained in Section 2.2. For example, in Figure 3, an access to 16 sequential blocks starting at VLBN 0, will be broken into four disk I/Os executing in parallel and fetching full tracks: VLBNs 0-3 from disk 0, VLBNs 4-7 from disk 1, VLBNs 8-11 from disk 2, and VLBNs 12-15 from disk 3. Efficient access to the secondary dimension is achieved by mapping it to semi-sequential VLBNs. Figure 3 indicates the semi-sequential VLBNs with a dashed line. Requests to the semi-sequential VLBNs in a single quadrangle are all issued together in a batch. The disk's internal scheduler then chooses the request that will incur the smallest positioning cost (the sum of seek and rotational latency) and services it first. Once the first request is serviced, servicing all other requests will incur only a track switch to the adjacent track. Thanks to the semi-sequential layout, no rotational latency is incurred for any of the subsequent requests, regardless of which request was serviced first.
Naturally, the sustained bandwidth of semi-sequential access is smaller
than that of sequential access. However, semi-sequential access is more
efficient than reading
d effectively-random
VLBNs spread
across
d tracks, as would be the case in a normal striped disk
array. Accessing random
VLBNs will incur rotational
latency, averaging half a revolution per access. In the example of
Figure 3, the semi-sequential access, depicted by the
arrow, proceeds across
VLBNs
3.2 Quadrangle layout parametersThe values that determine efficient quadrangle layout depend on disk characteristics, which can be described by two parameters. The parameter N describes the number of sectors, or DLBNs, per track. The parameter H describes the track skew in the mapping of DLBNs to physical sectors. The layout and disk parameters are summarized in Table 1.
Track skew is a property of disk data layouts as a consequence of track switch time. When data is accessed sequentially on a disk beyond the end of a track, the disk must switch to the next track to continue accessing. Switching tracks takes some amount of time, during which no data can be accessed. While the track switch is in progress, the disk continues to spin, of course. Therefore, sequential LBNs on successive tracks are physically skewed so that when the switch is complete, the head will be positioned over the next sequential LBN. This skew is expressed as the parameter H which is the number of DLBNs that the head passes over during the track switch time.
Figure 4 shows a sample quadrangle layout and
its parameters. Figure 4(a) shows an example of how
quadrangle
VLBNs map to
DLBNs. Along the
3.2.1 Determining layout parametersTo determine a suitable quadrangle layout at format time, Atropos uses as its input parameters the automatically extracted disk characteristics, N and H, and the block size, b, which are given by higher level software. Based on these input parameters, the other quadrangle layout parameters, d and w, are calculated as described below.
To explain the relationship between the quadrangle layout
parameters and the disk physical parameters, let's assume that we want to
read one block of
b
DLBNs from each of
d tracks.
This makes the total request size,
S, equal to
To bound the response time for reading the
S sectors, we need
to find suitable values for
b and
d to ensure that
the entire request, consisting of
The maximal number of tracks,
d, from which at least one sector
each can be read in a single revolution is bound by the number of
head switches that can be done in a single revolution, so
If we fix
d, the number of sectors,
b, that yield
the most efficient access (i.e., reading as many sectors on a single
track as possible before switching to the next one) can be determined
from Equation 1 to get
Alternatively, if we fix
b, the maximal depth, called
For certain values of
N,
While it may seem that relaxing the one revolution constraint might
achieve better efficiency, Appendix B shows that this
intuition is wrong. Accessing more than
3.2.2 Mapping VLBNs to quadrangles
Mapping
VLBNs to the
DLBNs of a single quadrangle is
straightforward. Each quadrangle is identified by
With no media defects, Atropos only needs to know the
To avoid the overhead of keeping a table to remember the DLBNs for each quadrangle row, Atropos could reformat the disk and instruct it to skip over any tracks that contain one or more bad sectors. By examining twelve Seagate Cheetah 36ES disks, we found there were, on average, 404 defects per disk; eliminating all tracks with defects wastes less than 5% of the disk's total capacity. The techniques for handling grown defects still apply.
3.3 Practical system integration
Building an Atropos logical volume out of
p disks is
not difficult thanks to the regular geometry of each
quadrangle. Atropos collects a set of disks with the same
basic characteristics (e.g., the same make and model) and selects a
disk zone with the desired number of sectors per track,
N.
The
VLBN size,
b, is set according to application needs,
specifying the access granularity. For example, it may correspond to
a file system block size or database page size. With
b
known, Atropos uses disk parameters to determine the resulting
In practice, volume configuration can be accomplished in a two-step process. First, higher-level software issues a FORMAT command with desired values of volume capacity, level of parallelism p, and block size b. Internally, Atropos selects appropriate disks (out of a pool of disks it manages), and formats the logical volume by implementing a suitable quadrangle layout. 3.3.1 Zoned disk geometriesWith zoned-disk geometries, the number of sectors per track, N, changes across different zones, which affects both the quadrangle width, w, and depth, d. The latter changes because the ratio of N to H may be different for different zones; the track switch time does not change, but the number of sectors that rotate by in that time does. By using disks with the same geometries (e.g., same disk models), we opt for the simple approach: quadrangles with one wcan be grouped into one logical volume and those with another w(e.g., quadrangles in a different zone) into a different logical volume. Since modern disks have fewer than 8 zones, the size of a logical volume stored across a few 72 GB disks would be tens of GBs. 3.3.2 Data protection
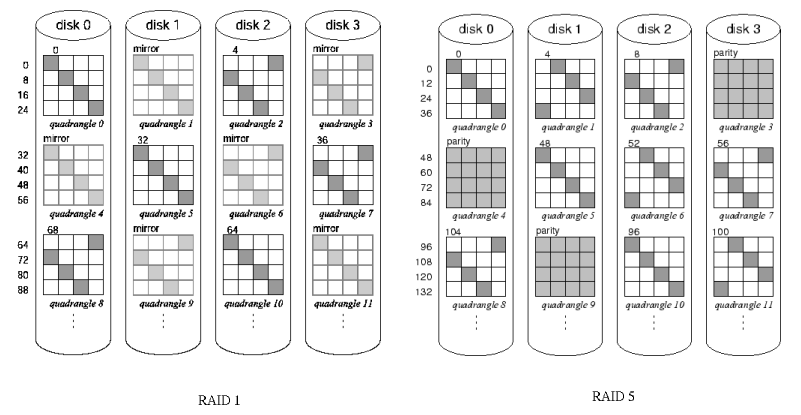
Data protection is an integral part of disk arrays and the
quadrangle layout lends itself to the protection models of
traditional RAID levels. Analogous to the parity unit, a set of
quadrangles with data can be protected with a parity quadrangle.
To create a RAID5 homologue of a parity group with quadrangles,
there is one parity quadrangle unit for every
3.3.3 Explicit information to applicationsTo allow applications to construct efficient streaming access patterns, Atropos needs to expose the parameter w, denoting the stripe unit size. I/Os aligned and sized to stripe unit boundaries can be executed most efficiently thanks to track-based access and rotating stripe units through all p disks. Applications with one-dimensional access (e.g., streaming media servers) then exercise access patterns consisting of w-sized I/Os that are aligned on disk track boundaries.
For applications that access two-dimensional data structures, and
hence want to utilize semi-sequential access, Atropos also needs to
expose the number of disks,
p. Such applications then
choose the primary order for data and allocate
Access in the primary-major order (columns in
Figure 2) consists of sequentially reading
Because of the simplicity of information Atropos exposes to applications, the interface to Atropos can be readily implemented with small extensions to the commands already defined in the SCSI protocol. The parameters p and wcould be exposed in a new mode page returned by the MODE SENSE SCSI command. To ensure that Atropos executes all requests to non-contiguous VLBNs for the other-major access together, an application can link the appropriate requests. To do so, the READ or WRITE commands for semi-sequential access are issued with the Link bit set. 3.3.4 Implementation detailsOur Atropos logical volume manager implementation is a stand-alone process that accepts I/O requests via a socket. It issues individual disk I/Os directly to the attached SCSI disks using the Linux raw SCSI device /dev/sg. With an SMP host, the process can run on a separate CPU of the same host, to minimize the effect on the execution of the main application. An application using Atropos is linked with a stub library providing API functions for reading and writing. The library uses shared memory to avoid data copies and communicates through the socket with the Atropos LVM process. The Atropos LVM organization is specified by a configuration file, which functions in lieu of a format command. The file lists the number of disks, p, the desired block size, b, and the list of disks to be used.
For convenience, the interface stub also includes three
functions. The function get_boundaries(
LBN) returns the stripe unit
boundaries between which the given
LBN falls. Hence, these
boundaries form a collection of
wcontiguous
LBNs for
constructing efficient I/Os. The get_rectangle(
LBN) function
returns the
With no outstanding requests in the queue (i.e., the disk is idle), current SCSI disks will immediately schedule the first received request of batch, even though it may not be the one with the smallest rotational latency. This diminishes the effectiveness of semi-sequential access. To overcome this problem, our Atropos implementation ``pre-schedules'' the batch of requests by sending first the request that will incur the smallest rotational latency. It uses known techniques for SPTF scheduling outside of disk firmware [14]. With the help of a detailed and validated model of the disk mechanics [,21], the disk head position is deduced from the location and time of the last-completed request. If disks waited for all requests of a batch before making a scheduling decision, this pre-scheduling would not be necessary. Our implementation of the Atropos logical volume manager is about 2000 lines of C++ code and includes implementations of RAID levels 0 and 1. Another 600 lines of C code implement methods for automatically extracting track boundaries and head switch time [22,26]. 4 Efficient access in database systemsEfficient access to database tables in both dimensions can significantly improve performance of a variety of queries doing selective table scans. These queries can request (i) a subset of columns (restricting access along the primary dimension, if the order is column-major), which is prevalent in decision support workloads (TPC-H), (ii) a subset of rows (restricting access along the secondary dimension), which is prevalent in online transaction processing (TPC-C), or (iii) a combination of both. A companion project [24] to Atropos extends the Shore database storage manager [3] to support a page layout that takes advantage of Atropos's efficient accesses in both dimensions. The page layout is based on a cache-efficient page layout, called PAX [1], which extends the NSM page layout to group values of a single attribute into units called ``minipages''. Minipages in PAX exist to take advantage of CPU cache prefetchers to minimize cache misses during single-attribute memory accesses. We use minipages as well, but they are aligned and sized to fit into one or more 512 byte LBNs, depending on the relative sizes of the attributes within a single page.
The mapping of 8 KB pages onto the quadrangles of the
Atropos logical volume is depicted in
Figure 6. A single page contains 16
equally-sized attributes, labeled A1-A16, where each attribute is
stored in a separate minipage that maps to a single
VLBN. Accessing
a single page is thus done by issuing 16 batched requests to every
Individual minipages are mapped across sequential runs of VLBNs. For example, to fetch attribute A1 for records 0-399, the database storage manager can issue one efficient sequential I/O to fetch the appropriate minipages. Atropos breaks this I/O into four efficient, track-based disk accesses proceeding in parallel. The database storage manager then reassembles these minipages into appropriate 8 KB pages [24].
Fetching any subset of attributes for a given page (record range) is thus a simple matter of issuing the corresponding number of I/Os, each accessing a contiguous region of the VLBN space mapped to a contiguous region on the disk. If several I/Os fall onto stripe units mapped to the same disk, the internal disk scheduler optimizes their execution by minimizing positioning times.
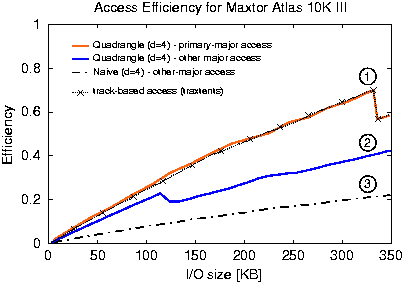
5 EvaluationThis section evaluates the performance of Atropos. First, it quantifies the efficiencies of sequential, semi-sequential and random accesses and shows the impact of disk trends on the layout parameter values. For all access patterns, Atropos achieves performance comparable or superior to conventional disk array data organizations. Second, trace replay experiments of a TPC-H workload on the Atropos implementation shows the benefit of matching the stripe-unit size to the exact track size and exposing it to applications. Third, the benefits of Atropos's data organizations are shown for (a subset of) queries from the TPC-H benchmark running on the Shore database storage manager [3] and our Atropos implementation. 5.1 Experimental setupThe experiments were performed on a four-way 500 MHz Pentium III machine with 1 GB of memory running Linux kernel v. 2.4.7 of RedHat 7.1 distribution. The machine was equipped with two Adaptec Ultra160 Wide SCSI adapters on two separate PCI buses, each controlling two 36 GB Maxtor Atlas 10K III disks. 5.2 Quantifying access efficiencyTraditional striped layouts of data across disks in a RAID group offer efficient (sequential) access along one major. The efficiency of accessing data along the other major is much lower, essentially involving several random accesses. Atropos's quadrangle layout, on the other hand, offers streaming efficiency for sequential accesses and much higher efficiency for the other-major access. We define ``access efficiency'' as the fraction of total access time spent reading/writing data from/to the media. The access efficiency is reduced by activities other than data transfer, including seeks, rotational latencies, and track switches. The efficiencies and response times described in this subsection are for a single disk. With p disks comprising a logical volume, each disk can experience the same efficiency while accessing data in parallel. 5.2.1 Efficient access in both majorsFigure 7 graphs the access efficiency of the quadrangle layout as a function of I/O size. It shows two important features of the Atropos design. First, accessing data in the primary-order (line 1) matches the best-possible efficiency of track-based access with traxtents. Second, the efficiency of the other other-major order access (line 2) is much higher than the same type of access with the Naïve layout of conventional disk arrays (line 3), thanks to semi-sequential access. The data in the graph was obtained by measuring the response times of requests issued to randomly chosen DLBNs, aligned on track boundaries, within the Atlas 10K III's outer-most zone (686 sectors or 343 KB per track ). The average seek time in the first zone is 2.46 ms. The drop in the primary-major access efficiency at the 343 KB mark is due to rotational latency and an additional track switch incurred for I/Os larger than the track size, when using a single disk.
The I/O size for the other-major access with the quadrangle layout
is the product of quadrangle depth,
d, and the number of
consecutive
DLBNs,
b, accessed on each track. For
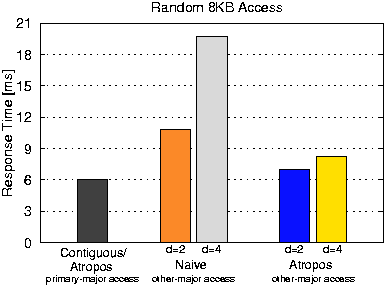
The efficiency of semi-sequential quadrangle access (line 2) with I/O sizes below 124 KB is only slightly smaller than that of the efficiency of track-based access with traxtents. Past this point, which corresponds to the one-revolution constraint, the efficiency increases at a slower rate, eventually surpassing the efficiency value at the 124 KB mark. However, this increase in efficiency comes at a cost of increased request latency; the access will now require multiple revolutions to service. The continuing increase in efficiency past the 124 KB mark is due to amortizing the cost of a seek by larger data transfer. Recall that each request includes an initial seek. 5.2.2 Random accesses in the other-majorFigure 8 compares access times for a random 8 KB chunk of data with different data layouts. The goal is to understand the cost of accessing data in the other-major order (e.g., row-major order access of the table in Figure 2). For context, a block in the primary-major has its data mapped to consecutive LBNs. Such an access incurs an average seek of 2.46 ms and an average rotational latency of half a revolution, followed by an 8 KB media access. The total response time of 5.93 ms is shown by the bar labeled ``Contiguous.'' Accessing 8 KB of data randomly spread across non-contiguous VLBNs (e.g., single row access in the Naïve layout of Figure 2) incurs nearly half of a revolution of rotational latency for each of the d accesses in addition to the same initial seek. Such an access results in a large response time, as shown by the bars labeled ``Naive.'' Database systems using the DSM data layout decomposed into d separate tables suffer this high penalty when complete records are retrieved.
In contrast, with the quadrangle layout, an access in the
other-major incurs only a single seek and much less total rotational
latency than the access in the traditional Naïve layout.
This access still incurs one (for
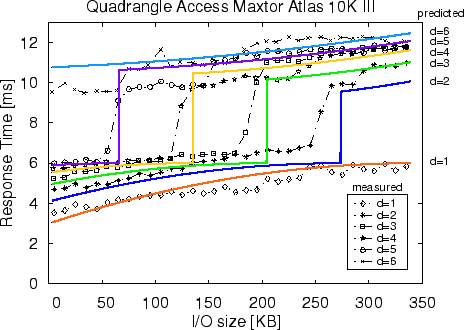
5.2.3 Access performance analysisUsing parameters derived in Section 3.2 and the analytical model described in Appendix A, we can express the expected response time for a quadrangle access and compare it with measurements taken from a real disk.
Figure 9 plots response times for quadrangle
accesses to the disk's outer-most zone as a function of I/O request
size,
S, and compares the values obtained from the analytic
model to measurements from a real disk. The close match between these
data sets demonstrates that Atropos can reliably determine proper
values of quadrangle layout analytically rather than empirically,
which may be time consuming. The data is shown for the Atlas 10K III
disk:
The plotted response time does not include seek time; adding it to the
response time would simply shift the lines up by an amount equivalent
to the average seek time. The total I/O request size,
S, shown
along the The most prominent features of the graph are the steps from the 6 ms to 10-12 ms regions. This abrupt change in response time shows the importance of the one-revolution constraint. If this constraint is violated by an I/O size that is too large, the penalty in response time is significant. The data measured on the real disk (dashed lines in Figure 9) match the predicted values. To directly compare the two sets of data, the average seek value was subtracted from the measured values. The small differences occur because the model does not account for bus transfer time, which does not proceed entirely in parallel with media transfer.
5.2.4 Effect of disk characteristics
Figure 9 shows the relationship between
quadrangle dimensions and disk characteristics of one particular
disk with
Table 2 also shows that, with
d set to
5.3 Track-sized stripe unitsWe now evaluate the benefits of one Atropos feature in isolation: achieving efficient sequential access by matching stripe units to exact track boundaries and exposing it to applications. To do so, we replayed block-level I/O traces of the TPC-H benchmark, representing a decision support system workload dominated by large sequential I/O. The original traces were captured on an IBM DB2 v. 7.2 system using 8 KB NSM pages and running each of the 22 TPC-H queries separately. The configuration specifics and the description of the trace replay transformations are detailed elsewhere [20].
For the experiments described in the remainder of this section, we
used a single logical volume created from four disks
(
To simulate the effects of varying stripe unit size and exposing its value to DB2, we modified the captured traces by compressing back-to-back sequential accesses to the same table or index into one large I/O. We then split this large I/O into individual I/Os according to the stripe unit size, preserving page boundaries.
To simulate traditional disk arrays with a (relatively small) hard-coded
stripe unit size, we set the stripe unit size to 64 KB (128
blocks) and called this base case scenario
64K-RAID. To simulate systems that approximate track size,
but do not take advantage of disk characteristics, we set the stripe
unit to 256 KB (512 blocks) and called this scenario
Approximate-RAID.
By taking advantage of automatically-extracted explicit disk
characteristics, Atropos can set the stripe unit size to the exact
track size of 343 KB and we called this scenario
Atropos-RAID.
For all experiments, we used the Atropos LVM cofigured for RAID 0
(i.e.,
The resulting I/O times of the 22 TPC-H queries are shown in Figure 10. The graph shows the speedup of the Approximate-RAID and Atropos-RAID scenarios relative to the base case scenario 64K-RAID. The results are in agreement with the expectations of sequential access efficiencies in Figure 7. The larger, more efficient I/Os of the Approximate-RAID and Atropos-RAID result in the observed speedup. The exact full-track access of Atropos-RAID provides additional 2%-23% benefit. Some fraction of the query I/Os are not sequential or stripe-unit sized (e.g., less than 1% for query 1 vs. 93% and 99% for queries 14 and 17, respectively). These differences explain why some queries are sped up more than others; Atropos does not significantly improve the small random I/Os produced by index accesses. The efficiency of Atropos-RAID is automatically maintained with technology changes (e.g., increasing numbers of sectors per track). While Approximate-RAID must be manually set to approximate track size (provided it is known in the first place), Atropos automatically determines the correct value for its disks and sets its stripe unit size accordingly, eliminating the error-prone manual configuration process.
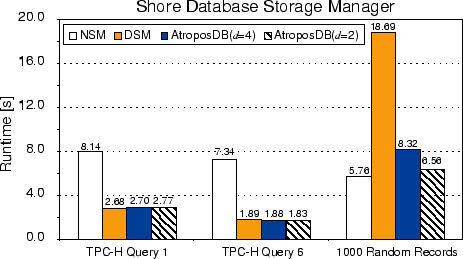
5.4 Two-dimensional data accessTo quantify the benefits of both efficient sequential and semi-sequential accesses, we used a TPC-H benchmark run on the Shore database storage manager [3] with three different layouts. The first layout, standard NSM, is optimized for row-major access. The second layout, standard DSM, vertically partitions data to optimize column-major access. The third layout, here called AtroposDB, uses the page layout described in Section 4, which can take advantage of Atropos's full set of features. Each setup uses an 8 KB page size.
The results for TPC-H queries 1 and 6 are shown in
Figure 11.[#] These queries scan through the LINEITEM table (the largest
table of the TPC-H benchmark), which consists of 16 attributes, and
calculate statistics based on a subset of six (Q1) and four (Q6)
attributes. As expected, the performance of DSM and
AtroposDB is comparable, since both storage models can efficiently
scan through the table, requesting data only for the desired
attributes.
NSM, on the other hand, fetches pages that contain full
records (including the attributes not needed by the queries), which
results in the observed Random record accesses to the LINEITEM table approximate an OLTP workload behavior, which is dominated by row-major access. For DSM, which is not suitable for row-major access, this access involves 16 random accesses to the four disks. For NSM, this access involves a random seek and rotational latency of half a revolution, followed by an 8 KB page access, resulting in a run time of 5.76 s. For AtroposDB, this access includes the same seek, but most rotational latency is eliminated, thanks to semi-sequential access. It is, however, offset by incurring additional track switches. With d=4, the run time is 8.32 s; with d=2, it is 6.56 s. These results are in accord with the random access results of Figure 8.
6 Related workAtropos builds upon many ideas proposed in previous research. Our contribution is in integrating them into a novel disk array organization, cleanly extending the storage interface to allow applications to exploit it, and evaluating the result with a real implementation executing benchmark database queries. Atropos's track-based striping is inspired by recent work on track-aligned extents [22], which showed that track-based access could provide significant benefits for systems using a single disk. Most high-end systems use disk arrays and LVMs, and Atropos allows those to utilize track-based access. Gorbatenko and Lilja [9] proposed diagonal disk layout of relational tables, allowing what we call semi-sequential access. Atropos integrates such diagonal layout with track-aligned extents to realize its support for two-dimensional data structures with no penalty to the primary access order. Section 2.4 describes how modern databases address the trade-off between row-major and column-major access to database tables. Recently, Ramamurthy and DeWitt proposed that database systems should address this trade-off by maintaining two copies of data, one laid out in column-major order and the other in row-major order, to ensure efficient accesses in both dimensions [15]. This approach, however, not only doubles the storage requirements, but also makes updates difficult; they must propagate to two copies that are laid out differently. Atropos provides efficient accesses in both dimensions with only one copy of the data. Denehy et al. [7] proposed the ExRAID storage interface that exposes some information about parallelism and failure-isolation boundaries of a disk array. This information was shown to allow application software to control data placement and to dynamically balance load across the independent devices in the disk array. ExRAID exposed coarse boundaries that were essentially entire volumes, which could be transparently spread across multiple devices. Atropos, on the other hand, defines a particular approach to spreading data among underlying devices and then exposes information about its specifics. Doing so allows applications to benefit from storage-managed parallelism and redundancy, while optionally exploiting the exposed information to orchestrate its data layouts and access patterns. 7 ConclusionsThe Atropos disk array LVM employs a new data organization that allows applications to take advantage of features built into modern disks. Striping data in track-sized units lets them take advantage of zero-latency access to achieve efficient access for sequential access patterns. Taking advantage of request scheduling and knowing exact head switch times enables semi-sequential access, which results in efficient access to diagonal sets of non-contiguous blocks.By exploiting disk characteristics, a new data organization, and exposing high-level constructs about this organization, Atropos can deliver efficient accesses for database systems, resulting in up to 4$\times$ speed-ups for decision support workloads, without compromising performance of OLTP workloads.
AcknowledgementsWe thank the members and companies of the PDL Consortium (including EMC, Hewlett-Packard, Hitachi, IBM, Intel, LSI Logic, Microsoft, Network Appliance, Oracle, Panasas, Seagate, Sun, and Veritas) for their interest, insights, feedback, and support. This work is funded in part by NSF grants CCR-0113660, IIS-0133686, and CCR-0205544, and by an IBM faculty partnership award.References[1] A. Ailamaki, D. J. DeWitt, M. D. Hill, and M. Skounakis. Weaving relations for cache performance. International Conference on Very Large Databases (Rome, Italy, 11--14 September 2001), pages 169--180. Morgan Kaufmann Publishing, Inc., 2001. [2] J. S. Bucy and G. R. Ganger. The DiskSim simulation environment version 3.0 reference manual. Technical Report CMU--CS--03--102. Department of Computer Science Carnegie-Mellon University, Pittsburgh, PA, January 2003. [3] M. J. Carey et al. Shoring up persistent applications. ACM SIGMOD International Conference on Management of Data (Minneapolis, MN, 24--27 May 1994). Published as SIGMOD Record, 23(2):383--394, 1994. [4] P. M. Chen and D. A. Patterson. Maximizing performance in a striped disk array. ACM International Symposium on Computer Architecture (Seattle, WA), pages 322--331, June 1990. [5] G. P. Copeland and S. Khoshafian. A decomposition storage model. ACM SIGMOD International Conference on Management of Data (Austin, TX, 28--31 May 1985), pages 268--279. ACM Press, 1985. [6] IBM DB2 Universal Database Administration Guide: Implementation, Document number SC09-2944-005. [7] T. E. Denehy, A. C. Arpaci-Dusseau, and R. H. Arpaci-Dusseau. Bridging the information gap in storage protocol stacks. Summer USENIX Technical Conference (Monterey, CA, 10--15 June 2002), pages 177--190, 2002. [8] G. R. Ganger. Blurring the line between OSs and storage devices. Technical report CMU--CS--01--166. Carnegie Mellon University, December 2001. [9] G. G. Gorbatenko and D. J. Lilja. Performance of two-dimensional data models for I/O limited non-numeric applications. Laboratory for Advanced Research in Computing Technology and Compilers Technical report ARCTiC--02--04. University of Minnesota, February 2002. [10] J. L. Hennessy and D. A. Patterson. Computer Architecture: A Quantitative Approach, 3rd ed. Morgan Kaufmann Publishers, Inc., San Francisco, CA, 2003. [11] R. Y. Hou and Y. N. Patt. Track piggybacking: an improved rebuild algorithm for RAID5 disk arrays. International Conference on Parallel Processing (Urbana, Illinois), 14--18 August 1995. [12] D. M. Jacobson and J. Wilkes. Disk scheduling algorithms based on rotational position. Technical report HPL--CSP--91--7. Hewlett-Packard Laboratories, Palo Alto, CA, 24 February 1991, revised 1 March 1991. [13] M. Livny, S. Khoshafian, and H. Boral. Multi-disk management algorithms. ACM SIGMETRICS Conference on Measurement and Modeling of Computer Systems, pages 69--77, 1987. [14] C. R. Lumb, J. Schindler, and G. R. Ganger. Freeblock scheduling outside of disk firmware. Conference on File and Storage Technologies (Monterey, CA, 28--30 January 2002), pages 275--288. USENIX Association, 2002. [15] R. Ramamurthy, D. J. DeWitt, and Q. Su. A case for fractured mirrors. International Conference on Very Large Databases (Hong Kong, China, 20--23 August 2002), pages 430--441. Morgan Kaufmann Publishers, Inc., 2002. [16] A. L. N. Reddy and P. Banerjee. A study of parallel disk organizations. Computer Architecture News, 17(5):40--47, September 1989. [17] M. Rosenblum and J. K. Ousterhout. The design and implementation of a log-structured file system. ACM Transactions on Computer Systems, 10(1):26--52. ACM Press, February 1992. [18] K. Salem and H. Garcia-Molina. Disk striping. International Conference on Data Engineering (Los Angeles, CA), pages 336--342. IEEE, Catalog number 86CH2261-6, February 1986. [19] J. Schindler. Matching application access patterns to storage device characteristics. PhD thesis. Carnegie Mellon University, 2004. [20] J. Schindler, A. Ailamaki, and G. R. Ganger. Lachesis: robust database storage management based on device-specific performance characteristics. International Conference on Very Large Databases (Berlin, Germany, 9--12 September 2003). Morgan Kaufmann Publishing, Inc., 2003. [21] J. Schindler and G. R. Ganger. Automated disk drive characterization. Technical report CMU--CS--99--176. Carnegie-Mellon University, Pittsburgh, PA, December 1999. [22] J. Schindler, J. L. Griffin, C. R. Lumb, and G. R. Ganger. Track-aligned extents: matching access patterns to disk drive characteristics. Conference on File and Storage Technologies (Monterey, CA, 28--30 January 2002), pages 259--274. USENIX Association, 2002. [23] M. Seltzer, P. Chen, and J. Ousterhout. Disk scheduling revisited. Winter USENIX Technical Conference (Washington, DC, 22--26 January 1990), pages 313--323, 1990. [24] M. Shao, J. Schindler, S. W. Schlosser, A. Ailamaki, and G. R. Ganger. Clotho: decoupling memory page layout from storage organization. Technical report CMU--PDL--04--102. Carnegie-Mellon University, Pittsburgh, PA, February 2004. [25] J. Wilkes, R. Golding, C. Staelin, and T. Sullivan. The HP AutoRAID hierarchical storage system. ACM Transactions on Computer Systems, 14(1):108--136, February 1996. [26] B. L. Worthington, G. R. Ganger, Y. N. Patt, and J. Wilkes. On-line extraction of SCSI disk drive parameters. ACM SIGMETRICS Conference on Measurement and Modeling of Computer Systems (Ottawa, Canada), pages 146--156, May 1995. A. Access Efficiency Calculations
Let
where the first term is the average rotational latency, and the second term is the media access time. For disks with zero-latency access, the first term is not constant; rotational latency decreases with increasing These expressions are derived elsewhere [19].
The efficiency of track-based access is the ratio between the raw one
revolution time,
where which is the maximal streaming efficiency of a disk.
The maximal efficiency of semi-sequential quadrangle access is simply
B. Relaxing the one-revolution constraint
Suppose that semi-sequential access to
d blocks, each of size
b, from a single quadrangle takes more than one
revolution. Then the inequality in Equation 1 will be larger
than 1.
With probability
However, with probability
To read the remaining
We can express the total response time for quadrangle access without
the one-revolution constraint as
The efficiencies of the quadrangle accesses with and without the
one-revolution constraint are approximately the same when the time spent in
rotational latency and seek for the unconstrained access equals to the
time spent in rotational latency incurred during passing over
Ignoring seek and approximating Thus, in order to achieve the same efficiency for the non-constrained access, we will have to access at least d VLBNs. However, this will significantly increase I/O latency. If R i.e., when there are no residual sectors, the one-revolution constraint already yields the most efficient quadrangle access.
Footnotes |
|
This paper was originally published in the
Proceedings of the 3rd USENIX Conference on File and Storage Technologies,
Mar 31-Apr 2, 2004, San Francisco, CA, USA Last changed: 17 March 2004 aw |
|

![\includegraphics[]{parallel-table.eps}](img11.png) [Naïve.]
[Naïve.]![\includegraphics[]{par-naivelayout.eps}](img12.png) [Atropos.]
[Atropos.]![\includegraphics[]{par-quadlayout.eps}](img13.png)
![\begin{figure*}\centering\subfigure[{\bf Logical layout in disk \ensuremath{LBN}...
...on disk sectors.}]{\epsfig{file=quad-phys-layout.eps, scale=0.95}} \end{figure*}](img132.gif)