
Figure 2: Diurnal cycle observed within the
traces - each graph shows 1 day worth of trace events.
The y-axis shows the number of observed requests per
minute.
As seen in figure 2, the amount of activity seen from the client population is strongly dependent on the time of day. The Berkeley web users were most active between 8:00pm and 2:00am, with nearly no activity seen at 7:00am. Services that receive requests from local users can thus expect to have widely varying load throughout the day; internationally used services will most probably see less of a strong diurnal cycle. Other details can be extracted from these graphs. For example, there is a decrease of activity at noon and at 7:00pm, presumably due to lunch breaks and dinner breaks, respectively.

Figure 3: Average diurnal cycle observed within the
traces - each minutes worth of activity shown is the average across 15 days
worth of trace events. The y-axis shows the average number of observed
requests per minute.
The diurnal cycle is largely independent of the day of the week, but there are some minor differences: for instance, on Fridays and Saturdays, the traffic peaks are slightly higher than during the rest of the week. However, the gross details of the traces remain independent of the day of the week. We calculated the average daily cycle observed by averaging the number of events seen per minute for each minute of the day across 15 days of traffic. For our calculation, we picked days during which there were no anomalous trace effects, such as network outages. Figure 3 shows this average cycle, including a polynomial curve fit that can be used to calculate approximate load throughout a typical day.

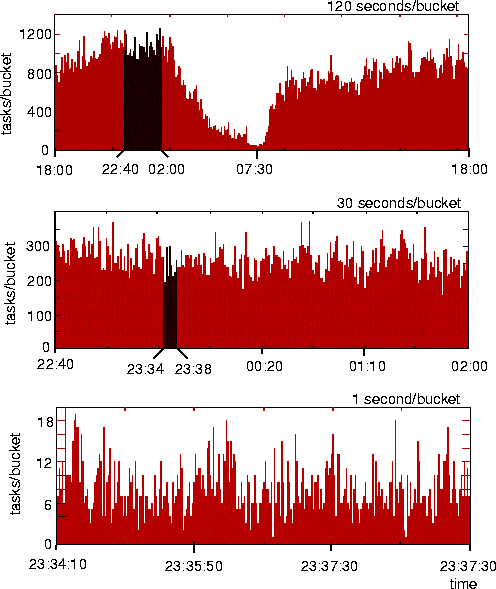
Figure 4: Request rate observed over a 24 hour,
3 hour, and 3 minute period of the traces.
On shorter time scales, we observed that client activity was less regular. Figure 4 illustrates the observed request rate at three time scales from a one-day segment of the traces. At the daily and hourly time scales, traffic is relatively smooth and predictable - no large bursts of activity are present. At the scale of tens of seconds, very pronounced bursts of activity can be seen; peak to average ratios of more than 5:1 are common.
Many studies have explored the self-similarity of network traffic ([4], [16], [21], [22], [24], [30]), including web traffic [9]. Self-similarity implies burstiness at all timescales - this property is not compatible with our observations. One indicator of self-similarity is a heavy-tailed interarrival process. As figure 5 clearly shows, the interarrival time of GIF requests seen within the traces is exponentially distributed, and therefore not heavy tailed. (We saw similar exponential distributions for other data types' request processes, as well as for the aggregate request traffic.) These observations correspond to requests generated from a large population of independent users.

Figure 5: Interarrival time distribution for GIF data type
requests seen within a day-long trace portion. Note that the
Y-axis is on a logarithmic scale.
Internet services must be able to handle rapidly varying and bursty load on fine time scales (on the order of seconds), but these bursts tend to smooth themselves out on larger time scales (on the order of minutes, hours, or days). The provisioning of resources for services is therefore somewhat simplified.